The Springboks have a great knack for showing you where your nonsense is.
It’s one of their great qualities, that only really dipped during that spell in the middle of the 2010s, where they showed that even one of the great institutions of the game can fall flat on its arse for a few years when they get a coaching hire wrong. Fortunately for the Springboks, and unfortunately for everyone else, they didn’t stay in that shape for very long and converted a golden generation of talent into the gold of the Webb Ellis trophy, back to back, only the second side to ever do so.
As it stands in 2025, you wouldn’t bet against them adding an unprecedented three-in-a-row in 2027.
Where does this iteration of the Springboks stand in the list of greatest sides of all time? They’re in the top two of all time, for me, and depending on the day, I don’t see how the great All Blacks of 2008 to 2015 live with them at their best.
It’s very hard to compare teams across eras, but I honestly don’t see how any team in the professional era comes close to winning must-win, can’t-lose games like Rassie Erasmus’ Springboks since 2018.
It would have been very easy for Rassie Erasmus to look at his victory in 2023 and decide, you know what, I’ve done all there is to do in this sport at test level. Back-to-back World Cups. A winning Lions series. Wide acclaim as one of the best teams ever. But no.
They want three in a row, and the title of undisputed kings of this sport at test level. Rassie wants it. And what he wants, he usually gets.

This is a guy who could have gone back to bullshitting and telling outrageous lies in an amateur setting, such is the right — the duty — of any man over the age of 55. But instead, he’s putting himself through the ringer of chasing something that nobody has ever done, and, honestly, if Erasmus can’t win three World Cups in a row, nobody can. Like I said, what he wants he usually gets.
And Rassie wants to beat Ireland in Dublin worse than you could ever imagine.
Ireland are a stone in Erasmus’s shoe. He’s beaten every other test side away from home in the last eight years — but not Ireland. In the second Chasing the Sun documentary, you could see him stewing in the Stade de France as Zombie rang around the stadium. It hurt him. Winning the World Cup was more than adequate compensation, but it stung him. The previous year, Ireland beat the Springboks by three points in Dublin on a day where it felt like the Springboks couldn’t kick a penalty to save their lives. Then, the summer after the World Cup, he was denied a 2-0 series win by Ciaran Frawley, who landed two drop goals in the last five minutes of a game Ireland were heading to defeat, tying the series 1-1. Ireland got the last laugh.
Rassie Erasmus gets the last laugh. Not anyone else. Ireland’s recent hoodoo over South Africa bothers him. It just does. It doesn’t make sense to him. Any game the Boks have lost to Ireland since he took over has had an average points differential of three points. A kick of the ball. It just doesn’t make sense to him.
South Africa haven’t beaten Ireland in Dublin since 2012.
Here’s another outrageous Rassie Erasmus lie. In 2017, Ireland beat the Springboks 38-3 in the Aviva Stadium, a game Rassie Erasmus attended.
When he joined the Springboks in early 2018, he said;
“I was in the stands at the Aviva Stadium with Jacques Nienaber … when we lost 38–3 to Ireland. That was the day I decided.”
Except, Rassie actually decided six months earlier when he triggered his six-month release clause with Munster and the IRFU in the Spring of 2017. It’s not quite on the level of Jaco Johann, but it’s part of what makes Rassie Erasmus the compelling main character of this sport that he is. He is half man, half myth. It sounds good that he saw South Africa in distress and decided to return as the conquering hero, so that’s the reality he wants to live in. I admire it. He shapes reality to his will, and everyone else follows.
This weekend, he wants reality to state that the Springboks finally nailed down Ireland in Dublin, with the world watching.
Will reality oblige?
***
That’s the challenge for Ireland, who have found the empty calories of beating a feckless Wallabies side by a record score to be as unsatisfying as a can of Coke for lunch. Sure, nice when you’re drinking it, but by four o’clock, you see it for what it was.
Last week didn’t convince me that Ireland were back. What Ireland? The Ireland we came to know between 2021 and 2023, when it seemed like our destiny was to win a World Cup, as we’d done more or less everything else. But our golden era of 2021-23 is getting further away with every passing game — that’s what happens when you look in the rear-view mirror.
South Africa didn’t stand still. They brought back Felix Jones, yes, but they also added in the excellent Jerry Flannery and decided to radically alter their DNA with the signing of Tony Brown as their attack coach. Change. Evolution. They wanted it, and made sure to go out and get it.
Bringing in a big-name, big-reputation coach as an assistant can be challenging for a guy like Erasmus, but when it comes to the Springboks, he has no ego. He wanted his ideas to be challenged, and challenged they would be.

Ireland, by contrast, are trying to rediscover what worked in 2023, with broadly the same personnel. Erasmus hasn’t radically changed his squad — only Feinberg-Mgomezelu, Steenekamp, Louw, Du Toit, Willemse, Moodie, Venter, Grobbellar/Wessels, Nortje, Esterhuizen (as a flanker/12 hybrid), and perhaps Grant Williams are new mainstays of his Category A team — but he’s trying out new combinations and new ways of doing things, even with stalwarts like Smith, Steph Du Toit, Etzebeth, Reinach, Marx, Kolisi, Snyman and De Allende anchoring.
Where are Ireland? Are we top four in the world or closer to top eight than we realise? Just how many more iterations of Marge’s Pink Dress can we find? How much nonsense has crept into the DNA of a side that values just how much they can “outsmart the muscle”?
We’ll find out this weekend.
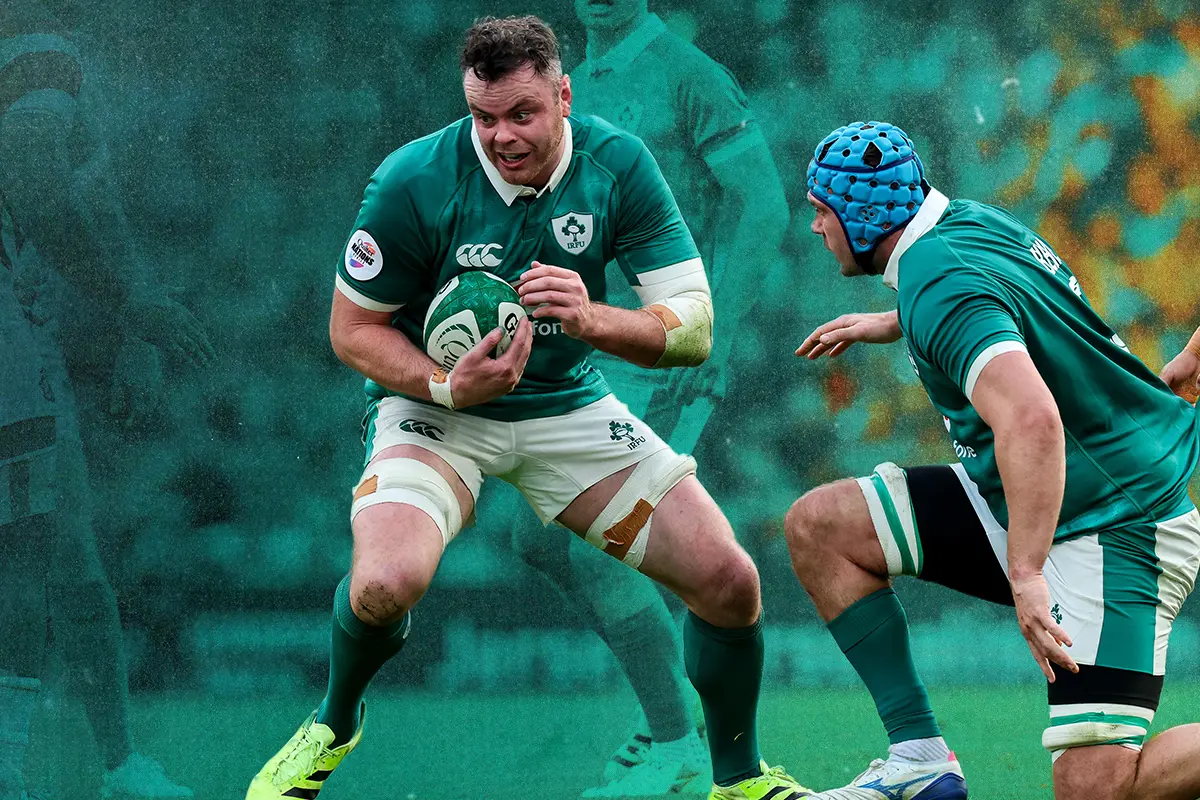
Ireland: 15. Mack Hansen; 14. Tommy O’Brien, 13. Garry Ringrose, 12. Bundee Aki, 11. James Lowe; 10. Sam Prendergast, 9. Jamison Gibson Park; 1. Andrew Porter, 2. Dan Sheehan, 3. Tadhg Furlong; 4. James Ryan, 5. Tadhg Beirne; 6. Ryan Baird, 7. Josh Van Der Flier, 8. Caelan Doris (c)
Replacements: 16. Ronan Kelleher, 17. Paddy McCarthy, 18. Finlay Bealham, 19. Cian Prendergast, 20. Jack Conan, 21. Craig Casey, 22. Jack Crowley, 23. Tom Farrell
South Africa: 15. Damian Willemse; 14. Canan Moodie, 13. Jesse Kriel, 12. Damian de Allende, 11. Cheslin Kolbe; 10. Sacha Feinberg-Mngomezulu, 9. Cobus Reinach; 1. Boan Venter, 2. Malcolm Marx, 3. Thomas du Toit; 4. Eben Etzebeth, 5. Ruan Nortje, 6. Siya Kolisi (c), 7. Pieter-Steph du Toit, 8. Jasper Wiese
Replacements: 16. Johan Grobbelaar, 17. Gerhard Steenekamp, 18. Wilco Louw, 19. RG Snyman, 20. Kwagga Smith, 21. Andre Esterhuizen, 22. Grant Williams, 23. Manie Libbok
So, what have South Africa been doing so far this season? In these metrics, I only counted the Rugby Championship games on up, as the other games were against lower-level opponents during the summer window.
Overall profile – what this South Africa team looks like
Across 9 games
22 entries
- South Africa: 93 entries → about 10.3 per game
- Opponents: 66 entries → about 7.3 per game
→ They consistently win the access battle; more trips into the 22 is almost a given.
Points per Entry (PPE) – weighted by entries
- South Africa: ≈ 3.2 points per entry
- Opponents: 2.5 points per entry
→ They don’t just get in more often, they also score more per visit.
Rucks & linebreaks
South Africa: 714 rucks / 66 linebreaks
- ≈ 79 rucks and 7.3 linebreaks per game
- LBR ≈ 9.2 linebreaks per 100 rucks
Opponents: 661 rucks / 54 linebreaks
- ≈ 73 rucks and 6 linebreaks per game
- LBR ≈ 8.2 per 100 rucks
So per phase, the Boks are more explosive – roughly one linebreak every 10–11 rucks versus opponents at one every ~12–13 rucks.
Kicking profile
South Africa average about 26 kicks per 100 passes, which is roughly a 1:3.8 kick to pass ratio across the season.
Opponents are closer to 21 kicks per 100 passes, around 1:4.7.
→ In a “normal” game, the Boks kick more frequently than their opponents and still generate more linebreaks per ruck.
This is a territory-driven, power-ruck side that:
- Owns more entries,
- Scores more per entry,
- Lives comfortably in a relatively high linebreak environment,
- And leans into kicking more than the teams they’re playing.
How they behave across the repeat fixtures
They’ve played Australia, Argentina and New Zealand twice, which gives three neat mini-series to look at how the template behaves when teams get a second shot.
v Australia
Game 1 – SA 22–38 Australia
- Entries: SA 13 (1.4 PPE) vs Aus 11 (3.4 PPE)
- Rucks / LBs: SA 97 / 14, Aus 76 / 10
- SA lineout: 69%
- Kick to pass: SA 1:11.8 (tiny kicking volume), Aus 1:4.7
Pattern:
South Africa dominate volume – more entries, more rucks, more linebreaks.
But with a 69% lineout and almost no kicking relative to the rest of their season, they end up in a long-field, multi-phase game where Australia are far more clinical when they do get into the 22.
Game 2 – SA 30–22 Australia
- Entries: SA 6 (3.5 PPE) vs Aus 8 (2.3 PPE)
- Rucks / LBs: SA 69 / 4, Aus 76 / 7
- SA lineout: 100%
- Kick to pass: SA 1:3.4, Aus 1:5.2
Here it flips:
South Africa have fewer entries and fewer linebreaks, but:
- Perfect lineout,
- Normal Bok kicking volume.
They win by being colder and more ruthless per entry, while Australia have to do more work for fewer points.
v Argentina
Game 1 – SA 67–30 Argentina
- Entries: SA 10 (6.1 PPE) vs Arg 7 (3.0 PPE)
- Rucks / LBs: SA 82 / 11, Arg 63 / 2
- SA lineout: 100%
- Kick to pass: SA 1:3.2, Arg 1:4.4
This is template Bokball Deluxe:
- High contestable/territory kicking.
- Perfect lineout.
- Strong linebreak return.
- Huge PPE – South Africa don’t need many entries to run up a cricket score.
Game 2 – Argentina 27–29 South Africa
- Entries: SA 9 (3.2 PPE) vs Arg 8 (3.3 PPE)
- Rucks / LBs: SA 88 / 6, Arg 97 / 10
- SA lineout: 91%
- Kick to pass: SA 1:5.5, Arg 1:8.0
Even with a 91% lineout, the pattern shifts:
- Both teams go much more phase-heavy (fewer kicks).
- Argentina actually won the linebreak race and shade PPE.
- South Africa got out with a narrow win rather than a blowout.
This shows you can drag them out of their preferred game even when their lineout is strong, if you slow their kicking and survive the collisions. Easier said than done.
v New Zealand
Game 1 – New Zealand 24–17 South Africa
- Entries: SA 13 (1.3 PPE) vs NZ 5 (4.2 PPE)
- Rucks / LBs: SA 82 / 2, NZ 75 / 3
- SA lineout: 78%
- Kick to pass: SA 1:3.3, NZ 1:3.7
Classic “waste your dominance” performance:
- South Africa have more entries, more rucks, more field position.
- But with a sub-80% lineout and only 2 linebreaks, they can’t translate volume into points.
- New Zealand are brutally efficient with limited access.
Game 2 – New Zealand 10–43 South Africa
- Entries: SA 12 (3.3 PPE) vs NZ 4 (1.7 PPE)
- Rucks / LBs: SA 77 / 11, NZ 57 / 9
- SA lineout: 79%
- Kick to pass: SA 1:4.8, NZ 1:6.2
This is the statement win:
- Lineout is still only 79%, not in the 90s.
- But they smash the entries differential (12 vs 4) and carry a +1.6 PPE gap.
- Both sides have very high LBR on the day; South Africa simply owned the 22 so completely that New Zealand’s linebreaks don’t matter.
Taken together, the NZ pair shows:
With a slightly shaky lineout, South Africa can either:
- Be wasteful and lose (Game 1),
- Or crush you via territory and entries (Game 2), even without the maul fully online.
Lineout completion & opposition kick-to-pass
If you split the 9 games by South Africa’s lineout percentage:
- High lineout (≥90%):
vs Australia (W), Argentina home (W), Argentina away (W), Japan (W), France (W) – 5 games - Lower lineout (<90%):
vs Australia (L), New Zealand (L), Italy (W), New Zealand (W) – 4 games
A. High-lineout games (≥90%) – 5 games, 5 wins
On average:
- Lineout: ~96%
- Entries:
- SA: 9.4 per game
- Opp: 7.4 per game
PPE:
- SA: ≈ 4.2 points per entry
- Opp: ≈ 2.3 points per entry
Ruck & LBR:
- SA: 388 rucks / 35 LBs → 9.0 LBR per 100
- Opp: 394 rucks / 28 LBs → 7.1 per 100
Kicking:
- SA: ≈ 28.9 kicks per 100 passes (~1:3.5)
- Opp: ≈ 19.2 kicks per 100 passes (~1:5.2)
So when the lineout is humming:
- South Africa actually kick more, not less.
- Opponents kick less, almost certainly because:
- Any long kick to touch is a live scoring platform for SA.
- Teams steer away from feeding their set-piece.
This is the “ideal Bok environment”:
- They don’t need huge numbers of entries.
- They dominate PPE and win the LBR race.
- The territory game becomes brutally efficient because every good kick can end in a maul drive or a structured strike off clean ball.
B. Lower-lineout games (<90%) – 4 games, 2 wins / 2 losses
On average:
- Lineout: ~77–80%
- Entries:
- SA: 11.5 per game
- Opp: 7.25 per game
PPE:
- SA: 2.25 points per entry
- Opp: ≈ 2.7 points per entry
Ruck & LBR:
- SA: 326 rucks / 31 LBs → 9.5 per 100
- Opp: 267 rucks / 26 LBs → 9.7 per 100
Kicking:
- SA: ≈ 22.7 kicks per 100 passes (~1:4.4)
- Opp: ≈ 23.7 kicks per 100 passes (~1:4.2)
Here, the picture changes:
South Africa still win entries and ruck volume, but:
- Their own PPE drops sharply from 4.2 → 2.25.
- Opponents’ PPE rises and actually edges theirs in this band.
- The LBR environment is hot for both sides – both teams are bouncing around 9.5–9.7 linebreaks per 100 rucks.
- Kicking volume becomes much more balanced:
- South Africa kick less than in the high-lineout games.
- Opponents kick a bit more, or at least feel able to kick without “automatic punishment” from the SA lineout.
This is where games like:
- Australia 38–22 SA (lineout 69%, SA barely kick),
- New Zealand 24–17 SA (78%, SA waste entries),
sit alongside:
- Italy 14–32 SA (83%, workmanlike win),
- New Zealand 10–43 SA (79%, massive win driven by entries and defence).
So the lower-lineout band is more volatile:
- The Boks can be wasteful and lose.
- Or, if they nail territory and 22 control, they can still blow you away without a dominant maul or strike platform.
How lineout and opposition kicking actually interact
Putting it together:
- When South Africa’s lineout is strong (≥90%):
- They kick more often (around 1:3.5 kick:pass).
- Opponents kick less (around 1:5.2).
- The territory trade favours the Boks because:
- They want to generate lineouts.
- Every kick to touch is a live scoring chance.
You see this clearly in games like:
- France 17–32 SA (100% lineout, SA 1:2.5 vs France 1:4.8),
- SA 67–30 Argentina (100%, SA 1:3.2 vs Arg 1:4.4).
When South Africa’s lineout slips below 90%:
- Their own kicking volume drops towards the low-mid 20s per 100 passes.
- Opponents are more willing to match or exceed their kicking.
- Games become higher LBR for both sides, with PPE much more balanced – or even tilting towards the opposition.
The match-ups with Australia and New Zealand in this band show both extremes:
- One where SA are wasteful and lose.
- One where they dominate entries so heavily that the lineout issues don’t save the opponent.
TL:DR, What Does All This Mean?
From this nine-game run, I can frame the Springboks in 2025 like this:
Baseline style
- South Africa play as a kicking-led, collision-heavy, 22-efficiency team.
- Expect around 10 entries per game, 3.2 PPE, and a linebreak every 10–11 rucks.
- They usually kick more than the opposition and still create more linebreaks per phase.
Lineout as the hinge
At ≥90% lineout, they’re effectively in “championship mode”:
- 5 wins from 5.
- PPE gap of roughly +2 points per entry.
- Clear LBR and kicking advantage.
Below 90%, the game becomes much more volatile:
- South Africa still dominate access, but PPE tilts back towards parity or better for the opposition.
- Both sides’ linebreak rates spike, and the scoreboard can swing.
Opposition kick-to-pass response
- Strong SA lineout suppresses opposition kicking – teams try not to feed it.
- Shaky SA lineout encourages opposition kicking – or at least removes the fear of automatically giving up scoring platforms.
- South Africa lean into their kicking game when the lineout is strong, and become more phase-oriented when it isn’t.
Ultimately, the Springboks are at their most destructive when the lineout is above 90% and they can kick with impunity. That’s when the territory trade becomes lethal; the opposition stops kicking, and South Africa’s entries and points per entry do the rest. Any plan against them has to stress the lineout first — otherwise you’re simply feeding the machine.