


If your gut instinct was that this game against New Zealand just didn’t look like the Ireland we have come to know under Andy Farrell, congratulations. Your gut instinct was correct.
This loss to New Zealand in the Aviva was notable for a tonne of different reasons, all of the negative. When I was watching it back on Saturday morning, my first thought was of how much it reminded me of Ireland’s last few games against England, the last one in Twickenham in particular. When I calculated out the ORW, it all made sense.
New Zealand took so much inspiration from England’s approach that it was like watching the same game back again with the opposition jersey colour inverted.
So how did New Zealand do it?
By owning the ball and owning time.
To get into it properly, we should have a look at the individual ORW scores.
| Dominant Clean | Guard Action | Attendance | Ineffective | Ruck Work Score | |
|---|---|---|---|---|---|
| 1. Porter | 8 | 1 | 1 | 15 | |
| 2. Kelleher | 7 | 14 | |||
| 3. Bealham | 9 | 3 | 2 | 17 | |
| 4. McCarthy | 3 | 3 | 2 | 5 | |
| 5. Ryan | 9 | 1 | 2 | 15 | |
| 6. Beirne | 8 | 1 | 3 | 11 | |
| 7. Van Der Flier | 1 | 14 | 2 | 2 | 29 |
| 8. Doris | 11 | 1 | 3 | 17 | |
| 9. Gibson Park | 0 | ||||
| 10. Crowley | 1 | 2 | |||
| 11. Lowe | 2 | 2 | 0 | ||
| 12. Aki | 10 | 1 | 21 | ||
| 13. Ringrose | 1 | 2 | 7 | ||
| 14. Hansen | 1 | 3 | 1 | 10 | |
| 15. Keenen | 2 | 4 | 14 | ||
| 16. Herring | 3 | 6 | |||
| 17. Healy | 2 | 4 | |||
| 18. O'Toole | 0 | ||||
| 19. Henderson | 3 | 1 | 4 | ||
| 20. O'Mahony | 3 | 6 | |||
| 21. Murray | 0 | ||||
| 22. Frawley | 1 | 2 | -2 | ||
| 23. Osbourne | 2 | 1 | 5 |
Top Five ORW Scorers
- Josh Van Der Flier – 29 points
- Bundee Aki – 21 points
- Finlay Bealham / Caelan Doris – 17 points
- Andrew Porter / James Ryan – 14 points
- Ronan Kelleher / Hugo Keenan – 14 points
As a general rule, when you see your top ORW scorer under 30 points, you haven’t had a great day at the office as a collective. When you see one of your centres second in the rankings, you have probably had a really bad day at the office. These rules are almost always accurate guides for a breakdown performance and it scans here during a historically poor display under Farrell.
McCarthy’s performance was the lowest in the pack by some distance and was closer to his usual ruck efficiency than the second test against South Africa, which was an aberration on his test season so far on these metrics. Right now I feel McCarthy is a moments player who is probably better suited to being a 20-minute guy but who we’re trying to force into being a 60-minute guy. He gives the team energy with defensive shots and counter-rucking but a player with only 8 ruck entries in 60 minutes doesn’t scan with the same player only managing five carries – with two turnovers.

That was followed by a poor performance by Tadhg Beirne who looked a little isolated from the zones where he usually racks up massive numbers. It follows on from the 26 ORW points he scored in the same #6 role in the second South Africa test – which is low for a guy who normally averages well into the 30s. Is the slightly wider alignment on attack that comes with the #6 role hurting Beirne in two ways? Essentially, he’s not explosive enough to be a weapon on those edges spaces and, away from the tight and near spaces, he’s not able to impact at the offensive breakdown with the power and reliability that he normally does.
But why are the numbers so low in general? Turnovers. Ireland lost 12 here, which has an obvious effect on ORW accumulation. When you turn the ball over – either in phase play or off the lineout – the attacking sequence is finished so the more turnovers you concede, the less ORW scoring you can achieve without bossing possession over the entire game.
What New Zealand did really well in this game was defend each ruck as its own entity. They didn’t just use a flat instruction when defending Ireland and that meant that they attacked any rucks we left open but stayed out of any that we looked to be resourcing with numbers. If there was a slow ruck on the edge, they counter-rucked through. If it was a flow ruck, they stayed out and folded.
Ireland’s turnover rate was quite high here but that, on its own, wouldn’t have been a problem if the All Blacks didn’t block out long periods with smart kicking, on-ball sequences, a solid lineout and kicking every goal-kicking opportunity they were awarded.
So that turnover rate coupled with the All Blacks bossing back-to-back-to-back possession sequences at key moments of the first and second half. That meant Ireland had a historically low number of rucks per game.
In the last year, Ireland have had 102 rucks per game on average in the seven games before last Friday’s loss to the All Blacks. On Friday night, Ireland only had 58 rucks, which was -42 on the seasonal average to that point. The next lowest after that was the loss to England in Twickenham.
When you look at the CORW scoring per ruck, you can start to see a pattern, even in the victories. Our efficiency – total CORW per ruck on average – shows performances under 4.0 are in danger of producing losses.
- New Zealand – 3.44 CORW per ruck (52 rucks)
- South Africa 2 – 4.14 CORW per ruck
- South Africa 1 – 3.79 CORW per ruck (14 turnovers)
- Scotland – 4.016 CORW per ruck
- England – 3.95 CORW per ruck (78 rucks)
- Wales – 3.95 CORW per ruck
- Italy – 2.88 CORW per ruck (14 turnovers)
- France – 4.07 CORW per ruck
The lowest-rated CORW efficiency score was against Italy in the Six Nations – a game we won 36-0 – but that featured a really high PPC rate, an on-ball Kick to Pass ratio and 14 turnovers. It didn’t matter in that game because we always got the ball back, and quickly. That wasn’t the case against the All Blacks.
We started the first five minutes pretty well but absolutely cratered in CORW scoring in the next half an hour, even including a sequence that scored minus numbers on the scale.
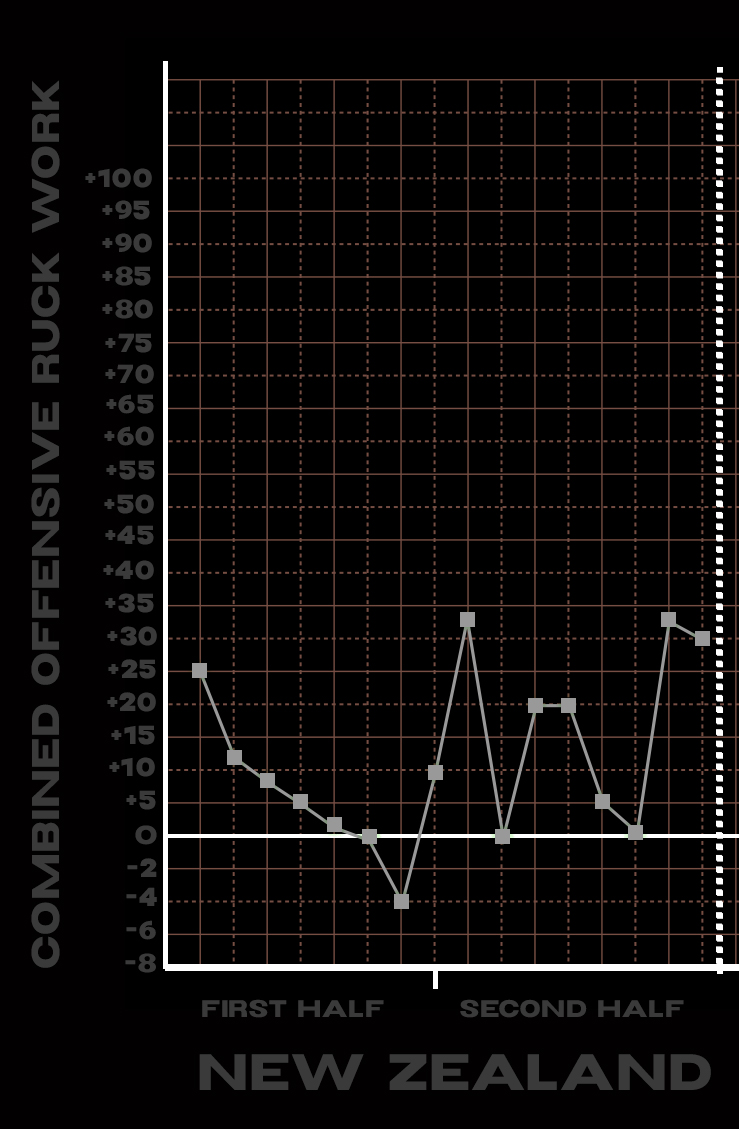
The All Blacks managed this with long sequences of tight phases in our half of the field that weren’t hugely expansive or particularly threatening but that engaged us on long defensive sequences. Each subsequence block of time became more expensive for Ireland to chase after, especially with New Zealand creeping ahead in three-point increments on multiple possessions.
They did a better job of this than England did, hence the more comfortable victory. Ireland will have to boss sequences against Argentina to remedy this, but they’ll know that instinctively. That means fewer turnovers, a more stable scrum and a much better lineout performance.