


You don’t need me to tell you that the Irish U20s had a difficult, energy-sapping campaign. The results speak for themselves. A wooden spoon in the U20 Six Nations and being a few seconds away from finishing last in the U20 World Championship shouts pretty loudly that something, somewhere, has gone badly wrong.
I’ll delve into the details in a later article. For now, I thought it would be interesting to examine the 20s Net Efficiency rating across their international season to see what it looked like.
As ever, here are your reading tips.
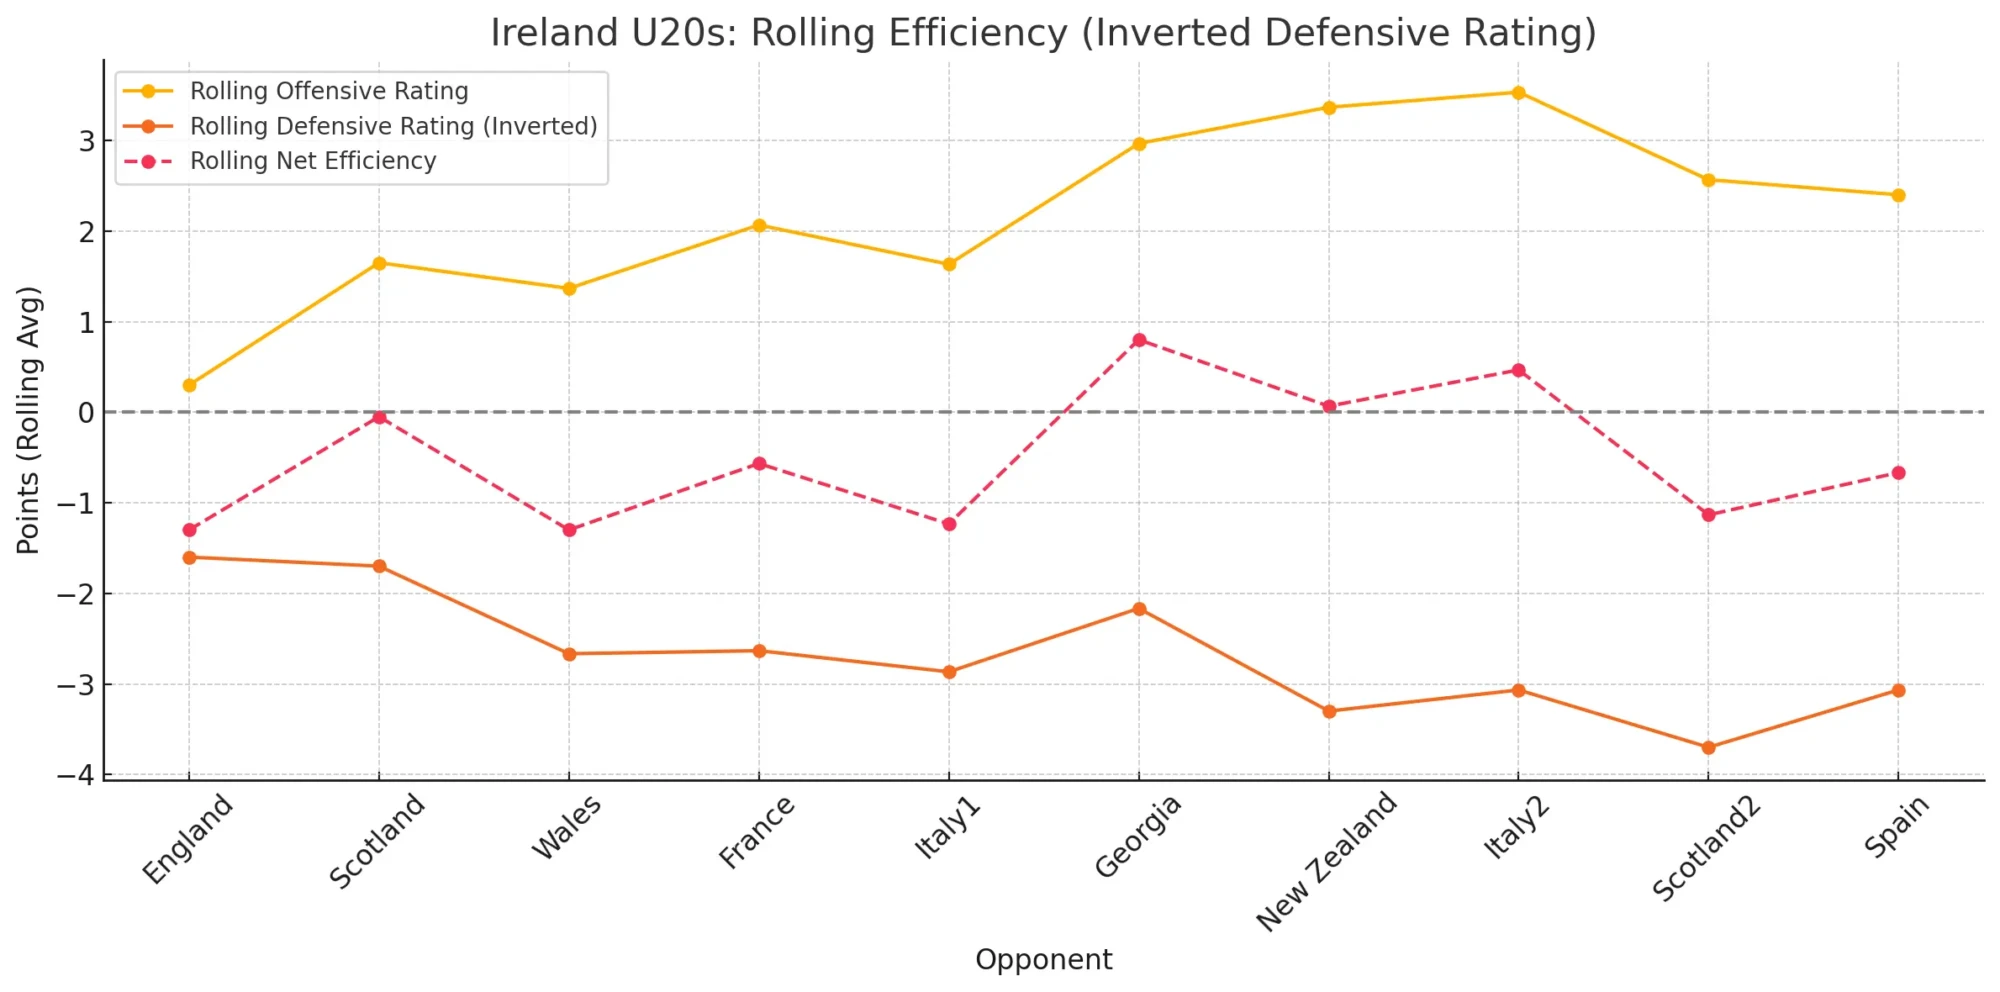
Rolling Offensive Rating
-
This is the average points Ireland scored per attacking 22 entry, shown as a rolling 3-match average.
-
A higher line here means the team was converting attacking chances into points efficiently.
Rolling Defensive Rating (Inverted)
-
This is the average points Ireland conceded per defensive 22 entry, inverted for visual clarity.
-
Inversion means that a lower number of points conceded is represented by a higher line, aligning visually with good performances.
-
A rising inverted defensive line = better defence.
Rolling Net Efficiency
-
This is the difference between points scored per attacking entry and points conceded per defensive entry, averaged over 3 games.
Zero Line Meaning
-
The grey dashed line at 0 represents the break-even point.
-
Above 0: Ireland are scoring more per 22 entry than they’re conceding → positive performance.
-
Below 0: Ireland are conceding more than they’re scoring → negative performance.
-
| Split | Avg Att. Entries | Avg Pts / Att Entry | Avg Def. Entries | Avg Pts Conceded / Def Entry | Avg Net Eff. |
|---|---|---|---|---|---|
| All 10 games | 9.8 | 2.5 | 8.6 | 2.4 | -0.0 |
| 6 losses | 9.7 | 1.8 | 8.2 | 3.1 | -1.3 |
| 4 wins | 10.0 | 3.5 | 9.3 | 1.6 | +1.9 |
Where the wins came from
Conversion, not volume.
- Points-per-entry ≥ 3.0 (Scotland1, Georgia, Spain) is the common thread in victories.
- Entry count hardly moves between wins and losses; what changes is finishing quality and a tighter goal-line defence (≈ 1.6 pts conceded/entry in wins vs 3.1 in losses).
The loss pattern
Two recurrent failure modes:
| Failure archetype | Example | Diagnostic |
|---|---|---|
| Blunt attack, ordinary defence | England (-1.3 NE) – 0.3 pts/entry on 9 entries | Plenty of ball, no payoff. |
| Good attack, catastrophic defence | Wales (-3.8 NE) – 0.8 pts/entry vs 4.6 pts conceded/entry | 14 entries but killed on three Welsh visits. |
80 % of net-negative games combine one of those two issues.
Rolling form (3-game average)
- Chart peak: Georgia ( +0.7 , +1.3, +2.3 ) – a three-game surge fuelled by big attacking returns.
- Chart trough: Scotland2 ( -2.2 ) – defensive concession spikes drag the trend down even when attack stays lively.
- Persistent below-zero valley: Two-thirds of the season; the side never strings more than two positive net games.
Correlation Clusters
| Variable vs Net Eff. | Rating | Practical take-away |
|---|---|---|
| Pts / Att Entry | Strong positive | Improve strike plays and decision-making inside the 22. It’s the clearest driver of outcomes. |
| Pts Conceded / Def Entry | Strong negative | Goal-line defence leakage wipes out any attacking gains. |
| Entry volume (Att or Def) | Weak | Simply having more entries (for or against) doesn’t decide the result — what each entry yields does. |
Benchmarks to flip close games
| KPI | Current win-line | Aspirational target |
|---|---|---|
| Points / Att. Entry | 3.0 | ≥ 3.2 (one extra converted try/penalty every 7 entries) |
| Pts Conceded / Def. Entry | 1.6 | ≤ 1.8 even on high-pressure nights |
| Net Efficiency | +1.9 in wins | Sustain +1.0 floor over any 3-match block |
If the group could have kept defensive concession under 2 pts/entry and sustained a ≥ 3 pts/entry strike rate, the rolling curve projected into consistent positive territory and flips most of the -1 to -1.5 losses.
When I crunched this data — making myself utterly miserable in the process — it became very clear that the margins of loss were thin in most cases. Both losses to Italy, the loss to Wales in the Six Nations and Scotland in the World Championship were all coin flips, for the most part. But why?
The biggest issue I found watching back came from one area of the game — Ireland’s desperately poor maul defence. It was a particular issue against Spain, but played a part in most of Ireland’s losses, often turning low-entry conceded games into losses or almost losses.
Almost all of the damage the Spanish did to Ireland at the weekend came off the back of their attacking maul, which, while well drilled, shouldn’t really have been as devastating as it was. For me, that comes back to our defensive maul being pretty poorly coached, or not having enough of a focus week to week.
There’s a bunch of examples to use, but I’ll focus on two. Let’s look at the early stages of this maul, which was pretty early in the game and a great opportunity for Ireland to shut the Spanish out.
Let’s see how it plays out for the first half.
For me, the key battle happens here on the infield side. David Walsh vs Alberto Gomez. Straight away, I think the lack of connection between Walsh and Usanov is a problem, and it’s amplified by not getting any contact with the opposition maul prior to contact.
This means less control, less impact on landing and a higher likelihood of losing your position on contact. Gomez controls the engagement on landing, getting lower than Walsh, dictating the angle of the engagement and setting up the pivot for the Spanish maul.

As the contact engages, Walsh is immediately controlled by Gomez, primarily due to height. Gomez can brace out longer than Walsh, who compresses under pressure, sending his back higher.
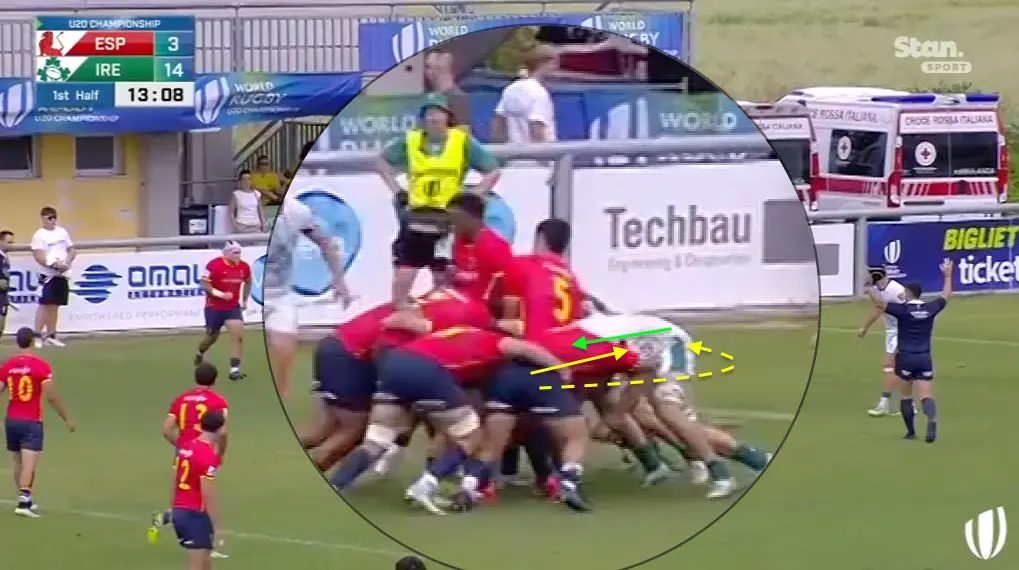
When we look at how the maul develops, you can see Gomez pinning Walsh in, and then allowing the Spanish maul to surge around him.
When the Spanish maul slips around, they have a clear “power line” through onto McCarthy, who steps in from the flanks but he’s got no chance of stopping that that maul as it swings around.
Literally none.
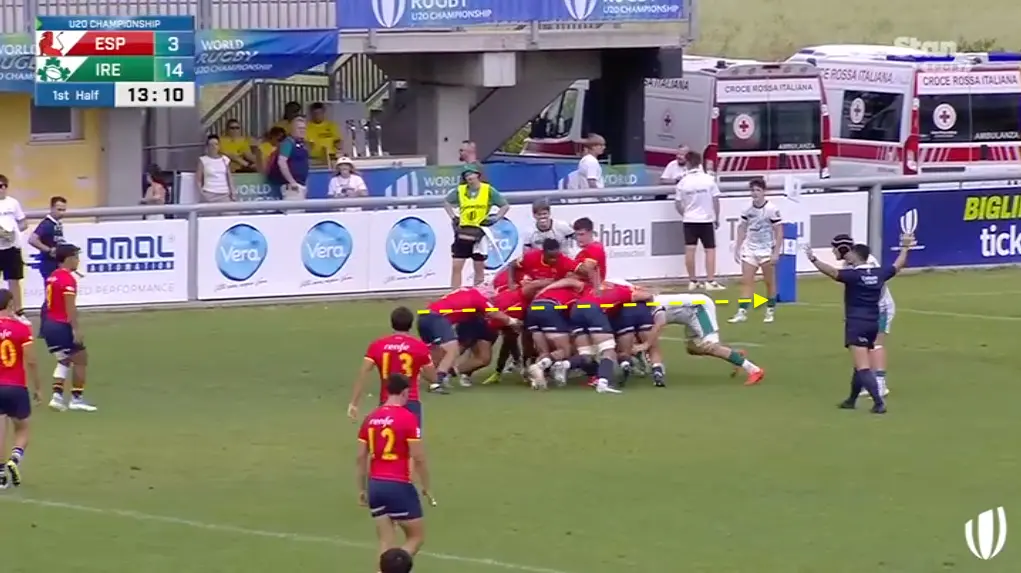
Once that maul shifts diagonally, it immediately pops out four Irish forwards, with a fifth resetting, and that means it’s, at best, Spain with a 7 v 2. And there’s only one winner there.

Ireland’s inability to control the flanks was a problem all day against Spain and, in reality, it’s been a problem all season.
The very same thing happened on Spain’s next 22 entry via a lineout drive, and were a little unlucky to be pulled back for a truck and trailer penalty. It’s the exact same maul; Gomez pinches in low, Ireland don’t control the drop and Spain shift around with very little problems.
Our inability to control the infield side of the maul meant Spain could slip around the corner over and over and over again.
Infield side slip, infield side slip and infield side slip.
Nobody fixed it. Not at halftime, not all season long, so any entry Spain — or anyone else — got with a lineout, led to consistent damage. If you can’t control the defensive maul at any kind of representative level, your ability to defend inside the 22 will plummet, your net efficiency will go with it, and losses will follow.