


Last season, we established a general baseline for Munster’s (and Ireland’s) attacking work through scoring efficiency at the breakdown. By doing this, I could see who was an effective breakdown player, and who wasn’t, and how our breakdown work ebbed and flowed throughout the game.
In previous years, I broke Offensive Ruck Work scoring into twenty-minute blocks, but I found that to be a blunt instrument. Last year, I started to use ten-minute blocks but when I looked back on the season, I found that while it was better than twenty-minute blocks when it came to illustrating the flow of possession, it didn’t quite get the importance of efficient ruck work as a ribbon that runs through the game.
I’ll be calculating the offensive ruck work scoring across five-minute blocks for the forthcoming season.
I think this is a better reflection of the ebb and flow between the two primary states in phase play – attack and defence. I will have a metric for measuring transition effectiveness by the end of October but, for now, I think I’m in a good place to use ORW to assess the heartbeat of Munster’s game – the ruck.
***
All you need is a pair of eyes to see that something has changed in Munster’s attack this season. It seems more fluid in some cases but it feels like the structure is more “all or nothing” than last season, as if the structure itself has been pared back a little. The numbers back this up; we are throwing more offloads than we ever have before relative to the rest of the league. We were 6th for offloads last season, but this season so far we’re second in the league for offloads thrown after two games. That’s a big change in and of itself.
Last season, we were 10th and 11th in the league for defenders beaten and clean breaks, respectively. This season already we’re fourth for defenders beaten, second in the league for metres gained and first in the league for clean breaks after two games. So what’s changed?
We are playing with fewer rucks per game than last season.
In the last five games of 2023/24, we averaged 95.6 rucks per game. This season so far that average has plummeted to 80.5. That’s a massive drop as a general average block for block, especially for a “one more ruck” team like Munster. That’s an average of 15 fewer rucks than the previous block of games. Is this a new approach? Is it a product of new personnel? Or are the players taking a few more liberties when it comes to execution?
Either way, with fewer rucks there’s an onus on efficiency and with more offloads per game, that puts pressure on our pack to resource the rucks that are showing up a little deeper and a little wider than they have previously.
As a result, the Collective Offensive Ruck Work is being spread evenly across the entire team, as opposed to a 2:1 split between the forwards and backs.
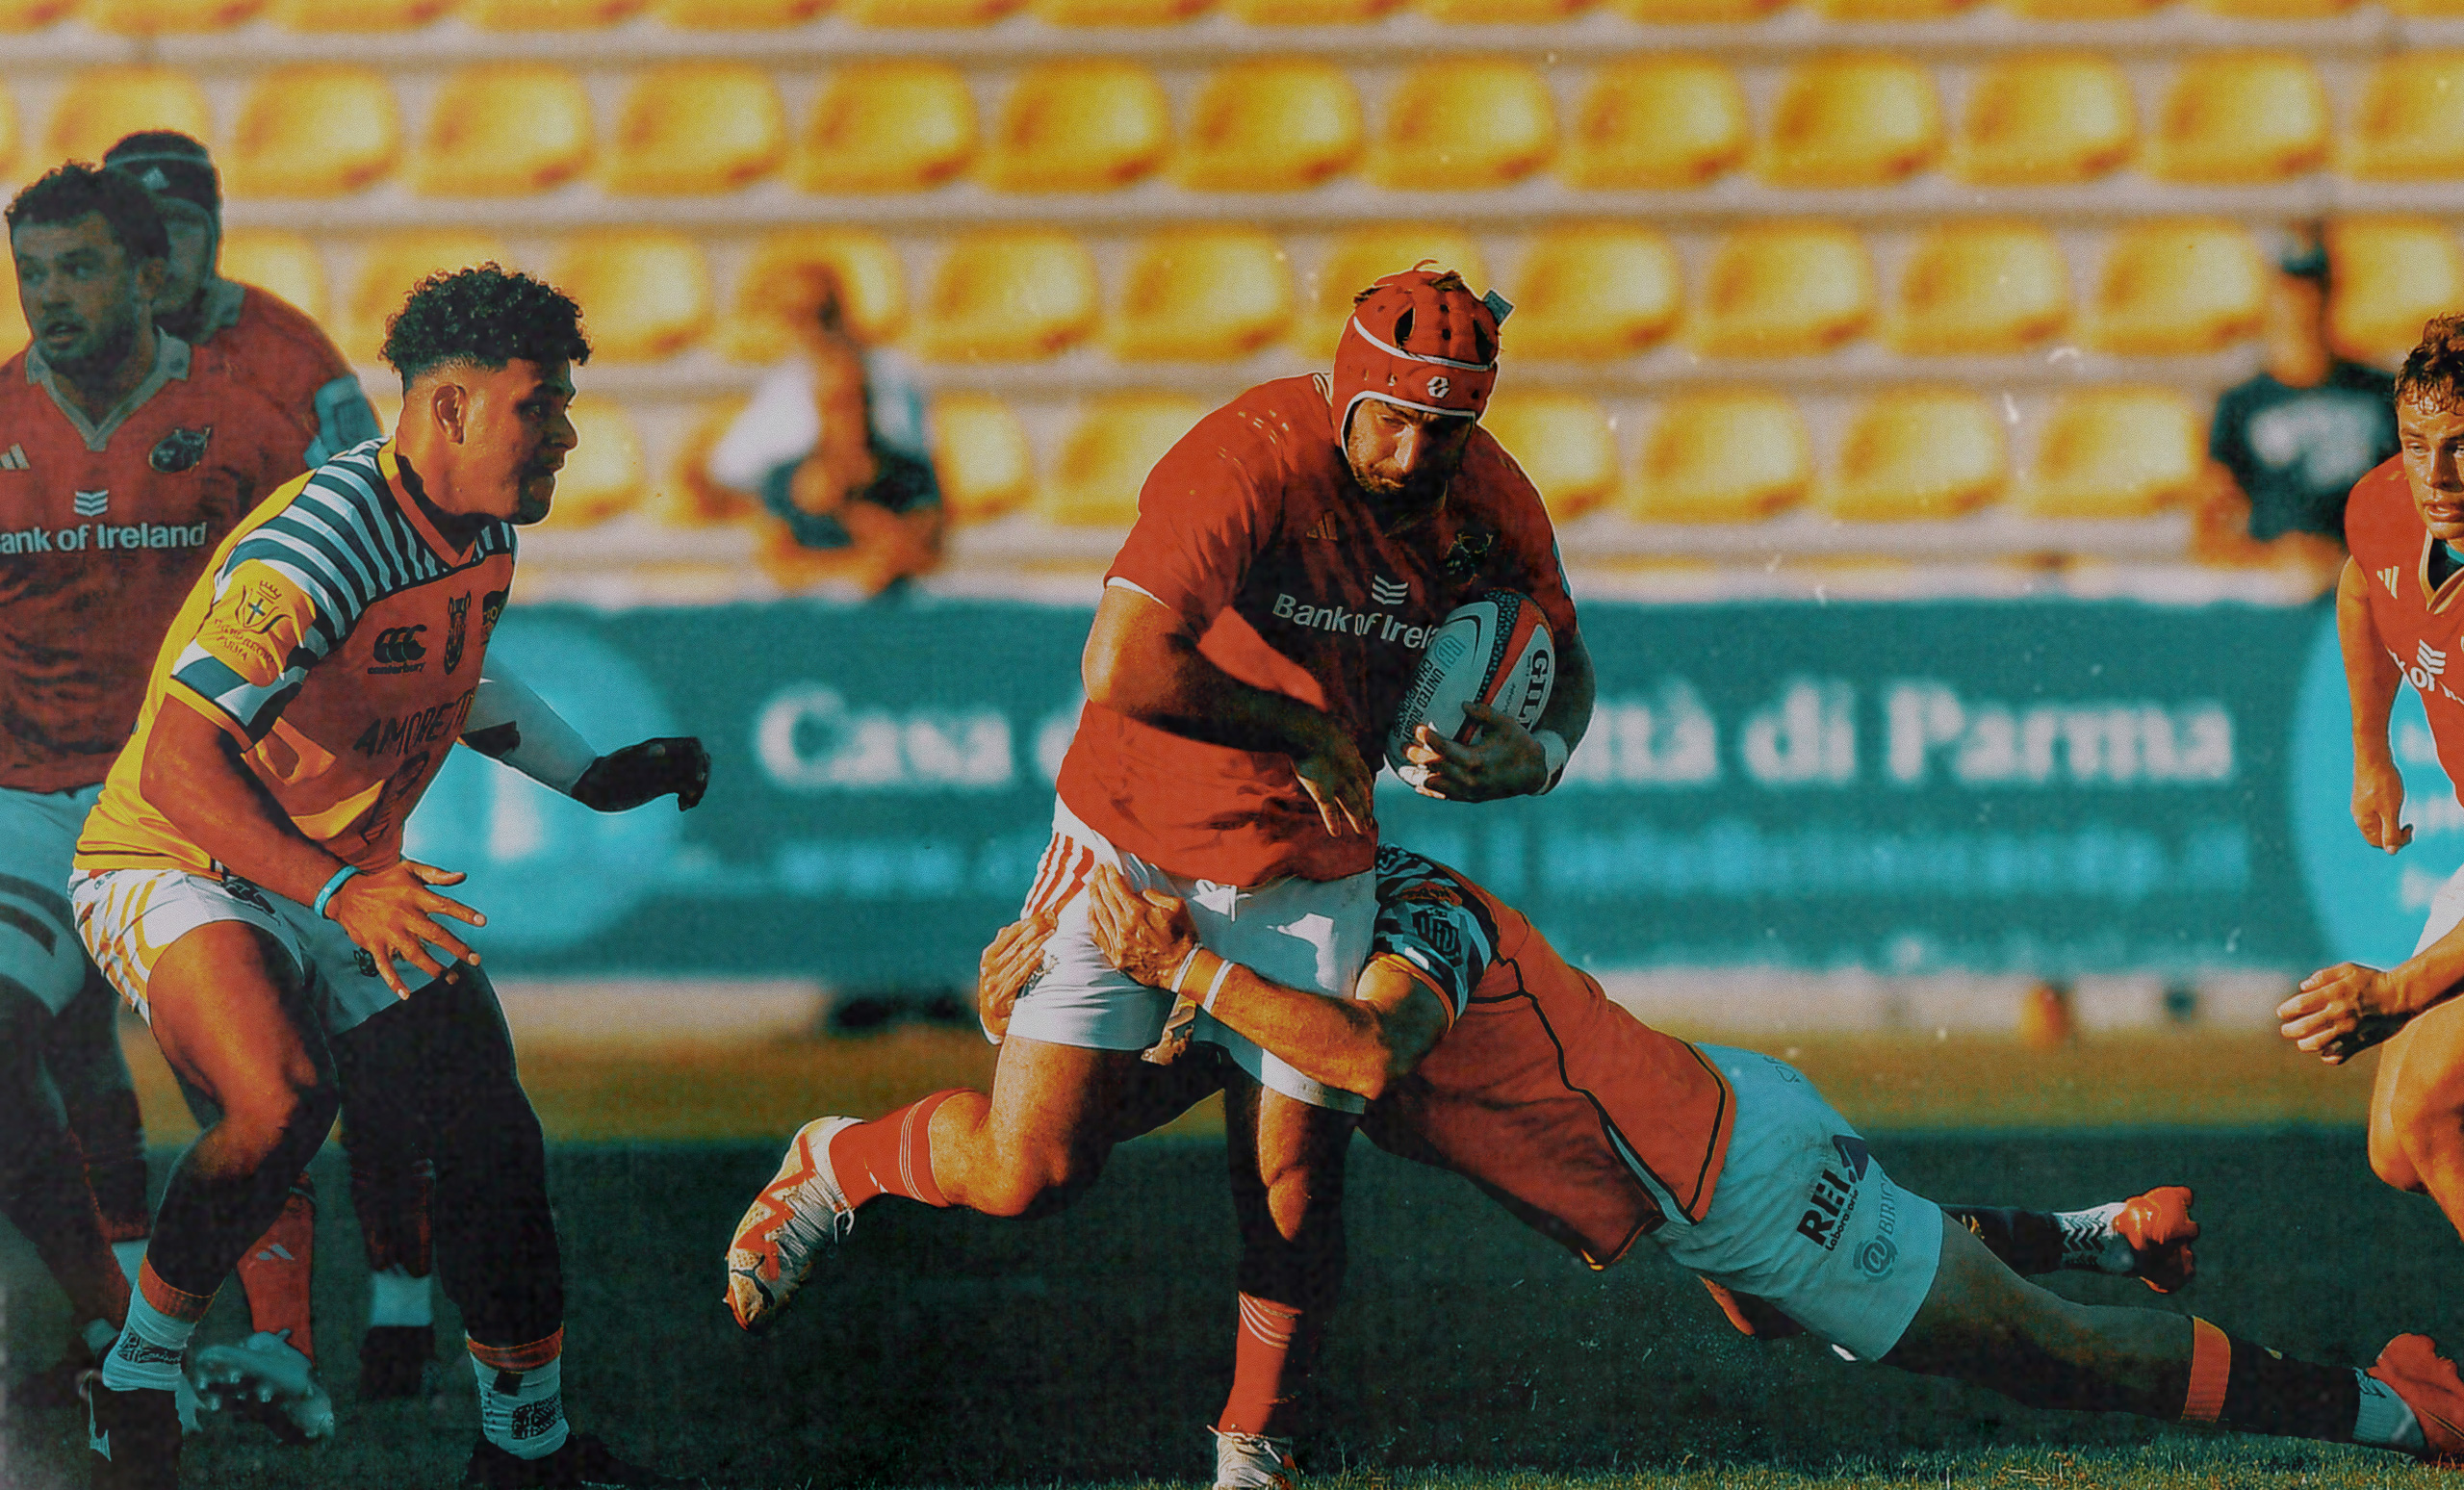
Here are the individual scores for the Connacht game.
| Dominant Clean | Guard Action | Attendance | Ineffective | Ruck Work Score | |
|---|---|---|---|---|---|
| 1. Loughman | 1 | 13 | 2 | 2 | 27 |
| 2. Barron | 14 | 2 | 1 | 28 | |
| 3. Ryan | 12 | 2 | 2 | 22 | |
| 4. Kleyn | 1 | 11 | 3 | 2 | 24 |
| 5. F. Wycherley | 1 | 10 | 6 | 7 | 15 |
| 6. Quinn | 1 | 9 | 1 | 22 | |
| 7. Hodnett | 1 | 10 | 23 | ||
| 8. Coombes | 1 | 16 | 1 | 33 | |
| 9. Casey | 1 | 3 | |||
| 10. Burns | 8 | 16 | |||
| 11. Daly | 1 | 12 | 1 | 28 | |
| 12. Nankivell | 8 | 16 | |||
| 13. Farrell | 8 | 16 | |||
| 14. Abrahams | 7 | 14 | |||
| 15. Haley | 10 | 1 | 18 | ||
| 16. Scannell | 9 | 1 | 16 | ||
| 17. J. Wycherley | 6 | 1 | 10 | ||
| 18. Jager | 2 | 2 | 10 | ||
| 19. O'Donoghue | 1 | 3 | 1 | 7 | |
| 20. Kendellen | 1 | 7 | 1 | 18 | |
| 21. Coughlan | 0 | ||||
| 22. Butler | 0 | ||||
| 23. O'Brien | 1 | 1 |
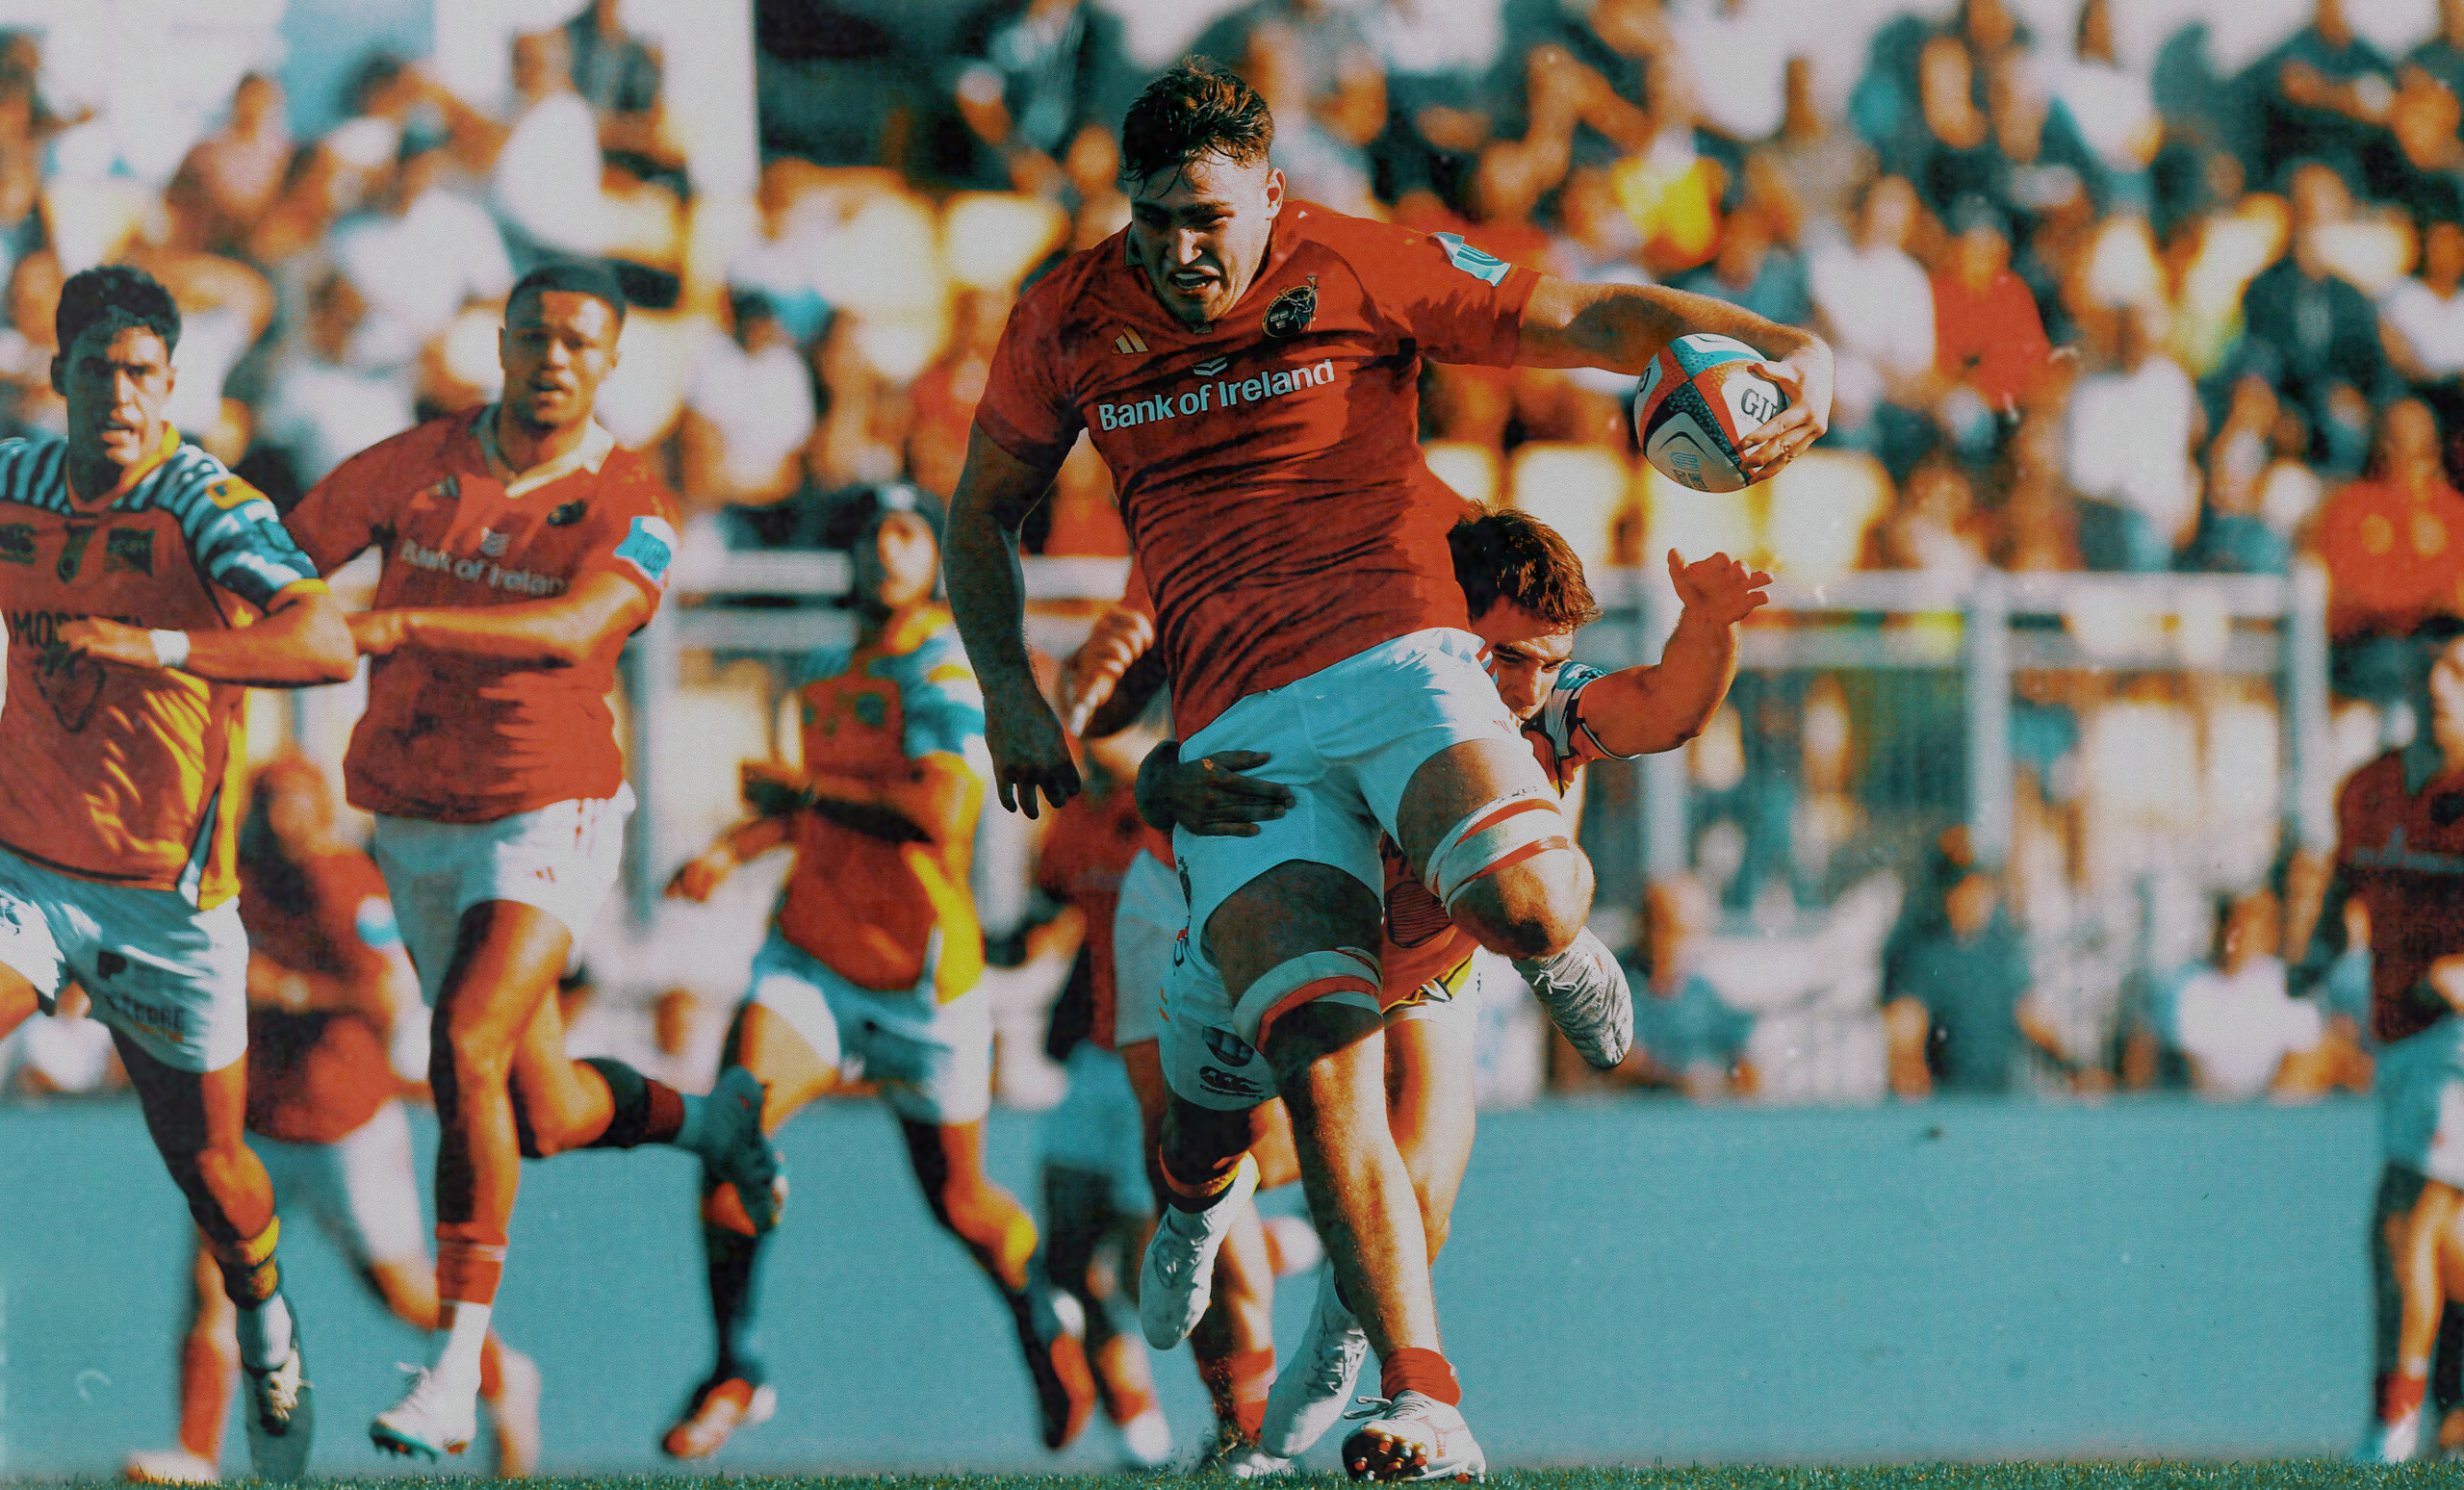
When we combine that with the scoring from the Zebre game as part of a two-game pattern, you can see it clearly. I moved Fitzgerald and McCarthy in with the starters to illustrate this on the table as they played the vast majority of the game.
| Dominant Clean | Guard Action | Attendance | Ineffective | Ruck Work Score | |
|---|---|---|---|---|---|
| 1. J. Wycherley | 3 | 11 | 1 | 29 | |
| 2. Barron | 5 | 10 | |||
| 3. Jager | 2 | 8 | 1 | 2 | 19 |
| 4. Kleyn | 3 | 8 | 4 | 3 | 23 |
| 5. F. Wycherley | 1 | 11 | 2 | 2 | 23 |
| 6. Quinn | 7 | 1 | 12 | ||
| 7. Hodnett | 1 | 6 | 1 | 1 | 14 |
| 8. Coombes | 7 | 2 | 16 | ||
| 9. Casey | 3 | 1 | 4 | ||
| 10. Butler | 1 | 2 | |||
| 23. McCarthy | 1 | 5 | 13 | ||
| 22. Fitzgerald | 10 | 20 | |||
| 12. Farrell | 8 | 2 | 1 | 16 | |
| 14. Nash | 1 | 5 | 13 | ||
| 15. Haley | 5 | 2 | 12 | ||
| 16. Scannell | 10 | 2 | 16 | ||
| 17. Loughman | 7 | 1 | 15 | ||
| 18. Ryan | 2 | 2 | 2 | 2 | |
| 19. O'Donoghue | 5 | 2 | 6 | ||
| 20. Daly | 1 | 1 | 0 | ||
| 21. Murray | 3 | 6 | |||
| 13. Daly | 1 | 2 | |||
| 11. Abrahams | 1 | 2 |
There is less than a 20-point differential between the top ORW scorer and the 15th-ranked one in both games to date. The outside backs averaged 18.4 ORW points per player against Connacht and 14.8 against Zebre. When you also consider that both games featured dramatically fewer rucks than last season, you can begin to piece together elements of what’s looked different this season.
We also need to acknowledge some of the poor individual performances at the core of these two performances. Jean Kleyn is underperforming his usual level at the moment, which is understandable due to his injury, but he’s joined by Fineen Wycherley and, arguably, Gavin Coombes. Wycherley, in particular, had two poor games in a row in the last two weeks with a large number of ineffective entries against Connacht and a lightweight performance against Zebre.
I will say that Fineen was probably the most aggressive of the back five players in both games when it came to stepping over the line with a few cleanouts, but even with that, I felt he was a little ahead or behind the play quite often so he was rarely able to truly dominate. As an aside, I’ve found his jumping on Munster restarts is a good illustration of where the added weight he’s stacked on – which he needed – has hurt some of his ability to get into the air cleanly.
Our edge forwards in the last two games – Quinn and Hodnett – have pretty much stayed in those zones and are active when the ball presents itself there. Both were more active against Zebre than they were against Connacht. Their numbers in both games are reflective of their breakdown roles being quite zone-focused – they don’t really roam all that much from their edge positioning. Hodnett, for example, is playing a wildly different offensive role from a small forward like Josh Van Der Flier when it comes to the breakdown. We are using him, essentially, as a power winger.
When we look at our CORW broken down into five-minute blocks, you can see how the troughs in our “heart beat” caused us damage.
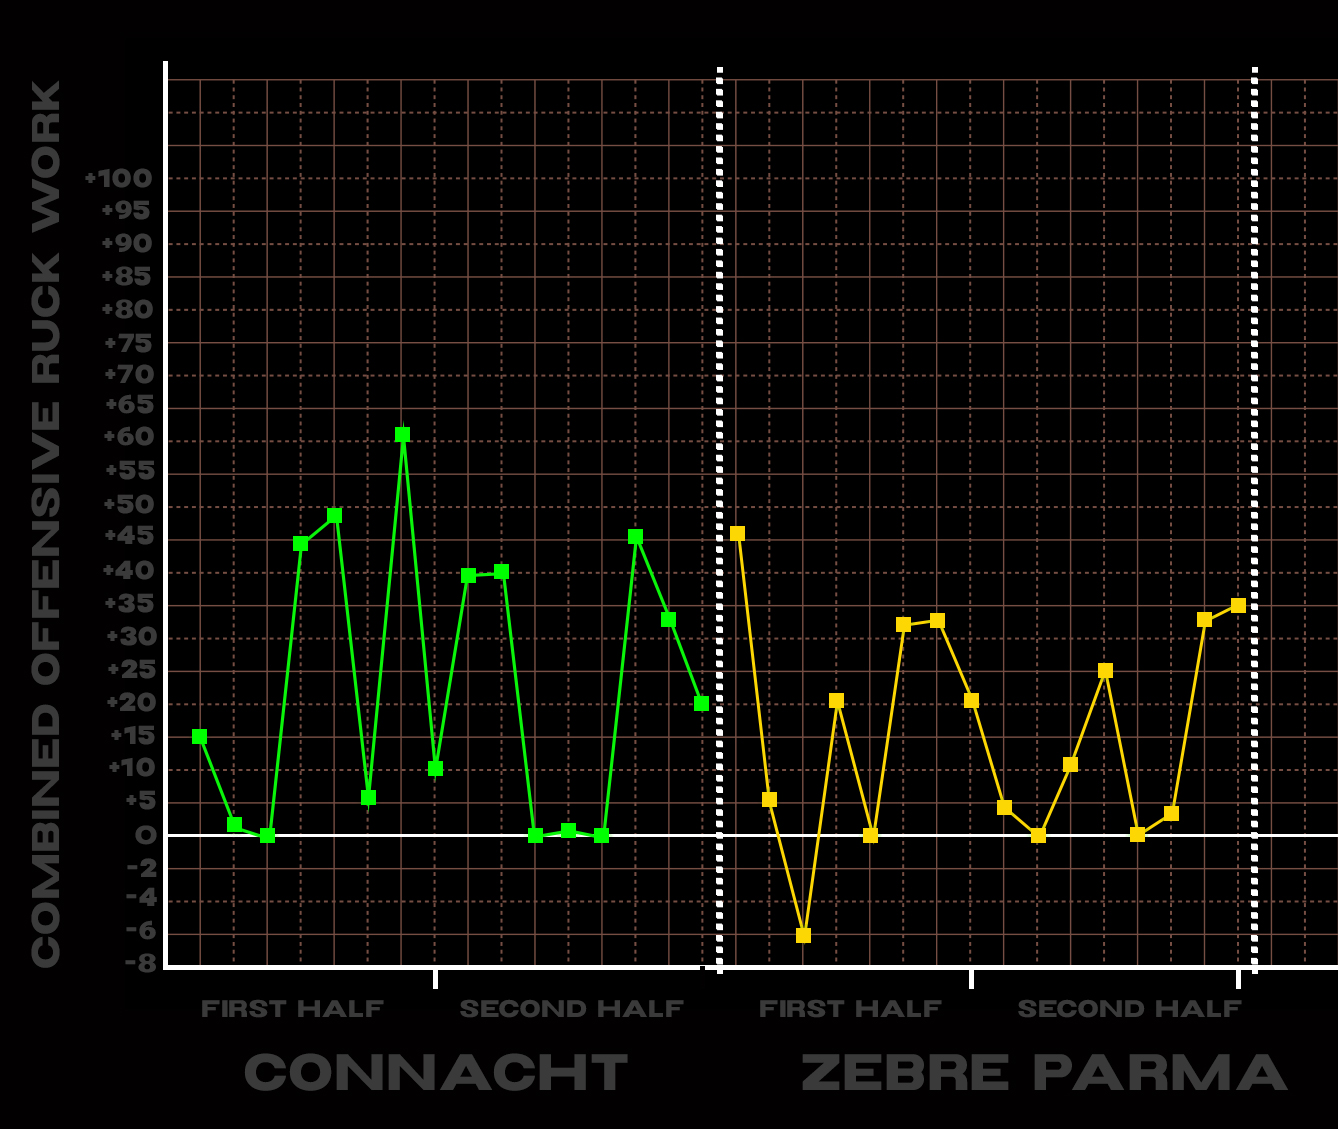
All of those troughs that reached below +5 in the scoring reflected deeply concerning periods where turnovers – error-related, poor kicking and clean steals – killed us stone dead when it came to conceding tries.
The start of the second half against Zebre was good but it was completely undermined by Haley’s sloppy intercept pass. That was a try conceded during a good period of ORW performance, so it hurt all the more. What was most concerning there is that we spent the next 15 minutes with sub +5 scoring.
If we look at the same period against Connacht, we can see it’s the big difference maker in the two results.
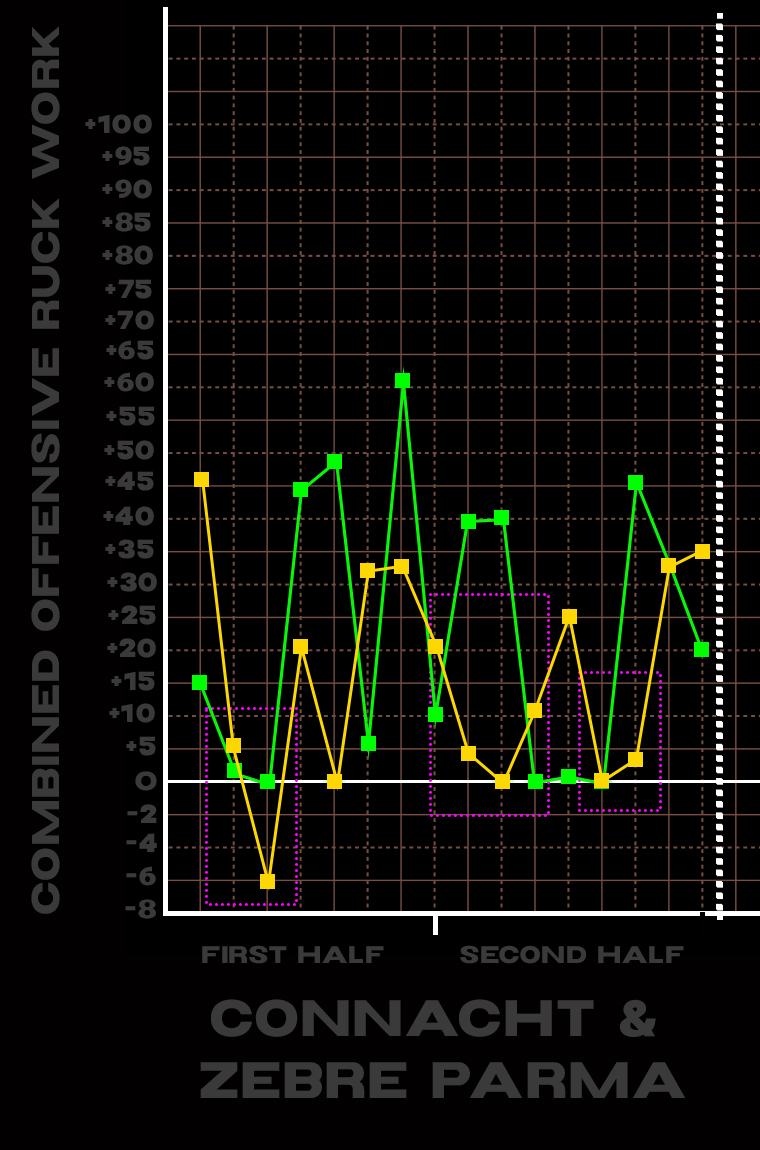
Even passable ball retention in those three five-minute blocks wins us the game. We’ll see if these possession patterns stack up against the Ospreys this weekend who are, arguably, the most dangerous defensive breakdown team we’ll play in the opening four rounds.