
This was a bizarre game.
Ireland were good. Australia were abysmal. But that doesn’t fully explain it either.
Before we delve into the article, let’s assess the Green Eye and determine if it translates to what we saw on the grass.
Data readout – Ireland v Australia
This game looked exactly like the model we’d built for it:
- Kicks / K:P – Ireland 45 kicks (1:4.4), Australia 25 (1:5.9). At half-time, Australia were at 1:9.1 to Ireland’s 1:5.5, so they only moved towards a kicking game once they were already behind.
- 22 Entries / PPE – Ireland 12 entries @ 3.8 points per entry, Australia 9 @ 2.1. We got the +3 entry gap we were looking for and comfortably out-finished them.
- Rucks / Linebreaks / LBR – Ireland 89 rucks, 7 linebreaks (~7.9 per 100); Australia 72 rucks, 2 linebreaks (~2.8 per 100). We had to work through a little more phase, but produced far more damage per ruck. Some of the linebreaks came in the last 20 for Ireland when Australia seemed more mentally checked out than the first half, but it still scans.
- Set-piece & turnovers – Lineout: Ireland 10/10 (100%), Australia 13/19 (68%). Turnovers lost: Ireland 12, Australia 18. Our kicking game fed directly into a heavy, low-return lineout load for them, and the scrum was a complete non-factor.
How Australia looked against their own season
When we drop this game back into Australia’s season profile from the Green Eye:
- Entries – Season average: 7.1 for, 9.1 against. Here: 9 for, 12 against. They actually improved their attacking entries slightly, but conceded even more than usual — we hit the upper end of the entries band we were targeting.
- Points per entry – Season attack: about 3.0 ppe; here 2.1 (well below par. Season defence: ~2.2 conceded; here 3.8 conceded (much worse). Their usual net efficiency of roughly +0.8 per entry flipped hard negative.
- Ruck volume – Season: around 110 rucks a game. Here: 72. They got into the sub-100 ruck zone we talked about, but Ireland still had more rucks and more linebreaks.
- LBR – Season attack: ~5.4 linebreaks per 100 rucks; here ~2.8/100, down in their Japan/NZ/Italy “no punch” tier. Season defence: ~7.0/100 conceded; here ~7.9/100, slightly worse again.
- Kick-to-pass – Season: 1:7.7. Here: 1:5.9 overall, but with that 1:9.1 first half. They only really nudged towards a Lions/Ireland-style kicking profile once the game state had already gone against them, and even then it had no accuracy or chase energy.
Where does this sit against our Green Eye scenarios?
In the Green Eye, we sketched out a few possible futures for Australia:
- Best-case pivot – sub-1:5.4 kick-to-pass, sub-100 rucks, and still strong LBR/PPE (the South Africa 1 template).
- Half-pivot – they kick a bit more and bring rucks down, but don’t close the entries gap or fix their defence.
This test landed in the worst version of that half-pivot scenario for Australia. The Wallabies did reduce their ruck load and moved their kick-to-pass closer to the benchmark we laid out, but they did it late, didn’t win territory, didn’t win entries, and saw both their LBR and points per entry collapse relative to their usual standards. From an Irish point of view, this was the model working exactly as drawn: we kicked more, owned more of the field, took more entries, and turned that into a decisive PPE edge that Australia’s season-long efficiency couldn’t rescue.
So, essentially, Ireland beat Australia with the exact template we’d expected from the pre-game numbers. They kicked more, controlled where the game was played and then turned that field position into a 12–9 edge in 22 entries. Once there, the gap in quality was stark: Ireland took 3.8 points per visit to Australia’s 2.1, scoring six tries from their dozen entries and leading for the entire game. Even in phase play, the picture was the same. Ireland actually had to work through more rucks (89–72), but most of those were in or around the 22. We produced seven linebreaks — roughly 7.9 per 100 rucks — against just two for Australia at about 2.8 per 100.
The result was a scoreboard that looked like a blowout but was really just the logical endpoint of Ireland winning the kicking battle first, the territory battle as a result, and then the red-zone battle.
***
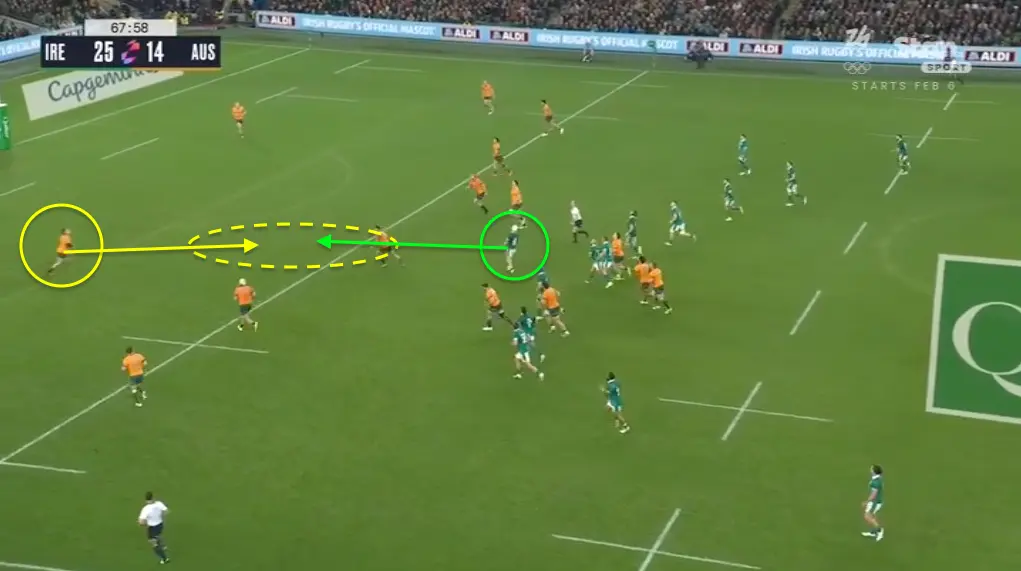
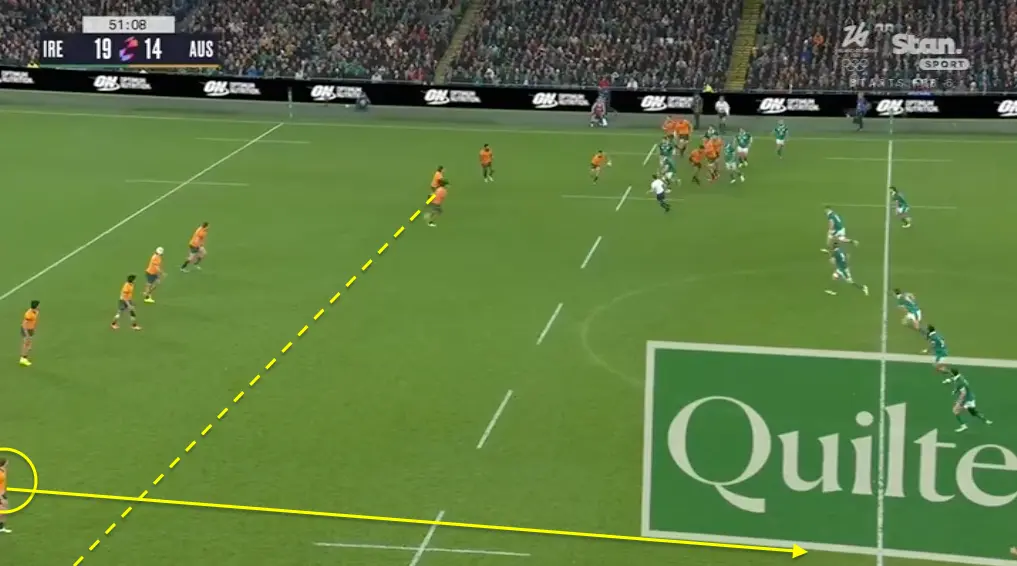
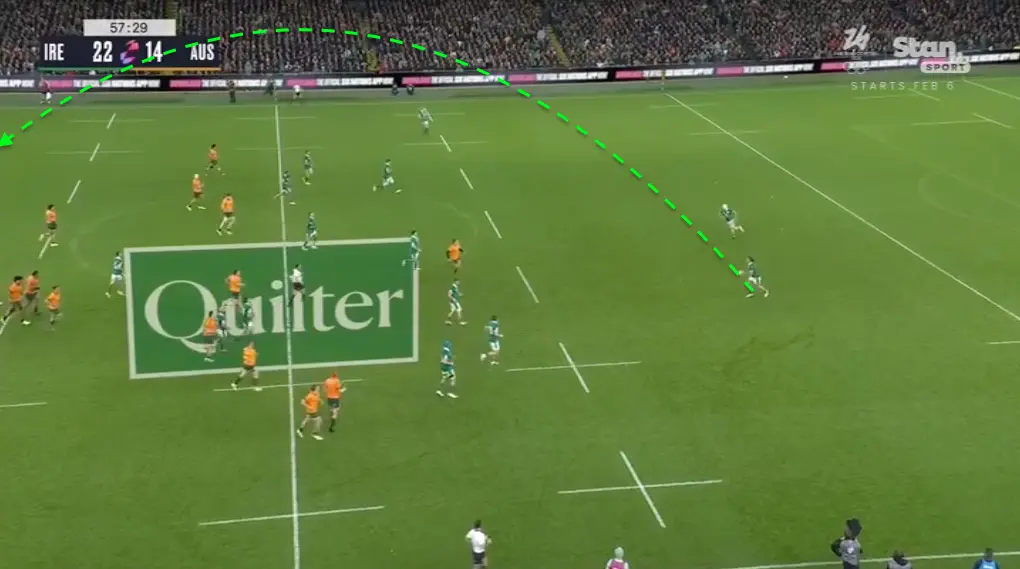
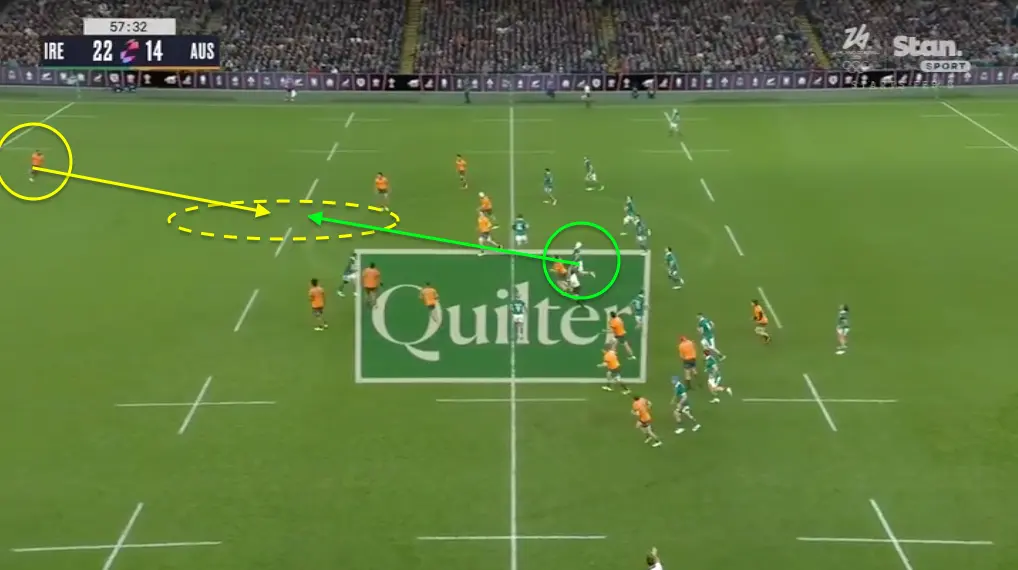
One thing Australia needed to do in this game was to lock out Ireland inside the first 20 minutes to empower any kicking or off-ball state that would follow. They failed at this almost immediately. The weather conditions helped immensely. The wet track and strong wind coming in over the North Stand essentially turned every Irish kick into a 40/50m territory gain due to a combination of excellent kicking from Sam Prendergast, elite-level chasing from Hansen, and genuinely abysmal receiving from Australia under the high ball. The wind turned his spiral bombs into greasy torpedoes that rained down on a back three that looked like they were told about the concept of contestable kicking during the anthems.
So how bad was it? How good was Ireland’s kicking and contesting?
I wanted to look into it and get a feel for what I thought was an incredibly lopsided aerial contest. So I went back and watched every contestable kick Ireland put up.
In this instance, I have defined a contestable as one that is kicked with the idea of a potential regather in mind, where a chaser and a defender can reasonably be expected to contest possession. It made for staggering watching.

Percentages
Of all the Irish kicks
Ireland kicked 45 times in total.
| Outcome | Kicks | % of all kicks |
|---|---|---|
| Contestable kicks | 15 | 33.3% |
| Contestables regathered by Ireland (net) | 10 | 22.2% |
| Contestables ending in Australia ball (incl. pen) | 5 | 11.1% |
So, one in every three Irish kicks was contestable, and about one in every five kicks was a contestable that Ireland actually got back.
Within the 15 contestable kicks
| Outcome | Kicks | % of contestables |
|---|---|---|
| No clean Australia catch | 13 | 86.7% |
| Clean Australia catch | 2 | 13.3% |
| Ireland possession (net) | 10 | 66.7% |
| Australia possession | 5 | 33.3% |
| Australia penalty off contestable | 1 | 6.7% |
Catch-Quality vs who ends up with the ball
| Catch quality & outcome | Kicks | % of contestables |
|---|---|---|
| Messy catch → Ireland ball | 9 | 60.0% |
| Messy catch → Australia ball (incl. pen) | 4 | 26.7% |
| Clean Aus catch → Ireland win next phase | 1 | 6.7% |
| Clean Aus catch → Australia ball retained | 1 | 6.7% |
Volume:
Ireland kicked 45 times, and a full third of those (15) were deliberate contestables rather than simple clearances.
Disruption rate:
In 13 of the 15 contestables (86.7%), Australia failed to claim a clean catch. It meant they rarely got the kind of clean, multi-phase launch they wanted off the back of backfield receipts.
Hit rate on regains:
Ireland turned 10 of 15 contestables (66.7%) into their own possession. That’s roughly a two-for-one trade: for every three contestables we kicked, we got the ball back twice.
Impact across the game:
First half: 5/8 regathered (62.5%)
Second half: 5/7 regathered (71.4%)