


Munster started the first block of the URC with five wins from five for 23 points from a possible 25.
By any measure, it’s an excellent start to the season that empowers some front-foot rotation through the dreaded middle block of the season between the end of November and March.
But outside of the wins, how are Munster doing when it comes to the key data points associated with longer-term — or larger scale — success?
That’s what I wanted to find out.
So I ran the numbers, not just for Munster, but for the entire URC to date and tried to get an idea of where we stood in terms of core metrics.
It should also be stated at this point that, internally, Munster very much see themselves as a work in progress. The November break post Argentina — which I didn’t include in these metrics to make sure there was an even span of games to compare — is very much looked at as another upgrading window where new bits and pieces are going to be layered on the work done since the summer, as well as an opportunity to workshop some game units which are still in need of repair, like the lineout.

In some respects, we won’t truly see where Munster are going as a team under McMillan until December 2026, when the head coach has had an opportunity to bring in some players that fit his vision and move on from those who don’t.
First, let’s consider phase play — Linebreaks per Ruck, 22 Efficiency, Net Efficiency and defensive actions inside the 22. I’ll compare this data afterwards.
Munster’s Attack
| Round | Rucks | Linebreaks | LBR | Per-100 | Entries | Pts/Entry | Tries | Tries/Entry |
|---|---|---|---|---|---|---|---|---|
| R1 | 70 | 10 | 0.1429 | 14.29 | 11 | 3.0 | 4 | 0.364 |
| R2 | 86 | 3 | 0.0349 | 3.49 | 8 | 2.8 | 3 | 0.375 |
| R3 | 94 | 5 | 0.0532 | 5.32 | 11 | 1.8 | 4 | 0.364 |
| R4 | 58 | 7 | 0.1207 | 12.07 | 8 | 3.5 | 4 | 0.500 |
| R5 | 137 | 5 | 0.0365 | 3.65 | 11 | 1.5 | 3 | 0.273 |
| Total (R1–R5) | 445 | 30 | 0.0674 | 6.74 | 49 | 2.44 | 18 | 0.367 |
Munster’s Defence
| Round | Opp Entries | Opp Pts/Entry | Tries Conceded | Tries Conceded/Entry |
|---|---|---|---|---|
| R1 | 12 | 1.7 | 3 | 0.250 |
| R2 | 8 | 2.5 | 4 | 0.500 |
| R3 | 8 | 2.3 | 3 | 0.375 |
| R4 | 11 | 1.2 | 2 | 0.182 |
| R5 | 5 | 3.0 | 3 | 0.600 |
| Total (R1–R5) | 44 | 1.98 | 15 | 0.341 |
So that’s the general data.
Let’s start breaking that down next to the rest of the league. First, we’ll look at Expected Tries. This is a little different from xG in soccer. Essentially, what it means is, relative to the conversion rates of the rest of the league so far, how many tries should Munster be scoring to keep up with that overall league average. Here, we see the effects of dog-it-out games, such as those played at home, in Cardiff, Edinburgh, and particularly in Connacht.
Expected Tries (at league average conversion rate)
| Entries | Munster Tries | Expected Tries (@ 39.27%) |
Actual − Expected | |
|---|---|---|---|---|
| For | 49 | 18 | 19.24 | -1.24 |
| Against | 44 | 15 | 17.28 | +2.28 prevented |
On a per-round basis — taking into account x-factors like weather conditions and opponent difficulty, we’re tracking very close to the league average with the scraps against Edinburgh in Cork, and Connacht in Thomond Park dragging the numbers down quite clearly. 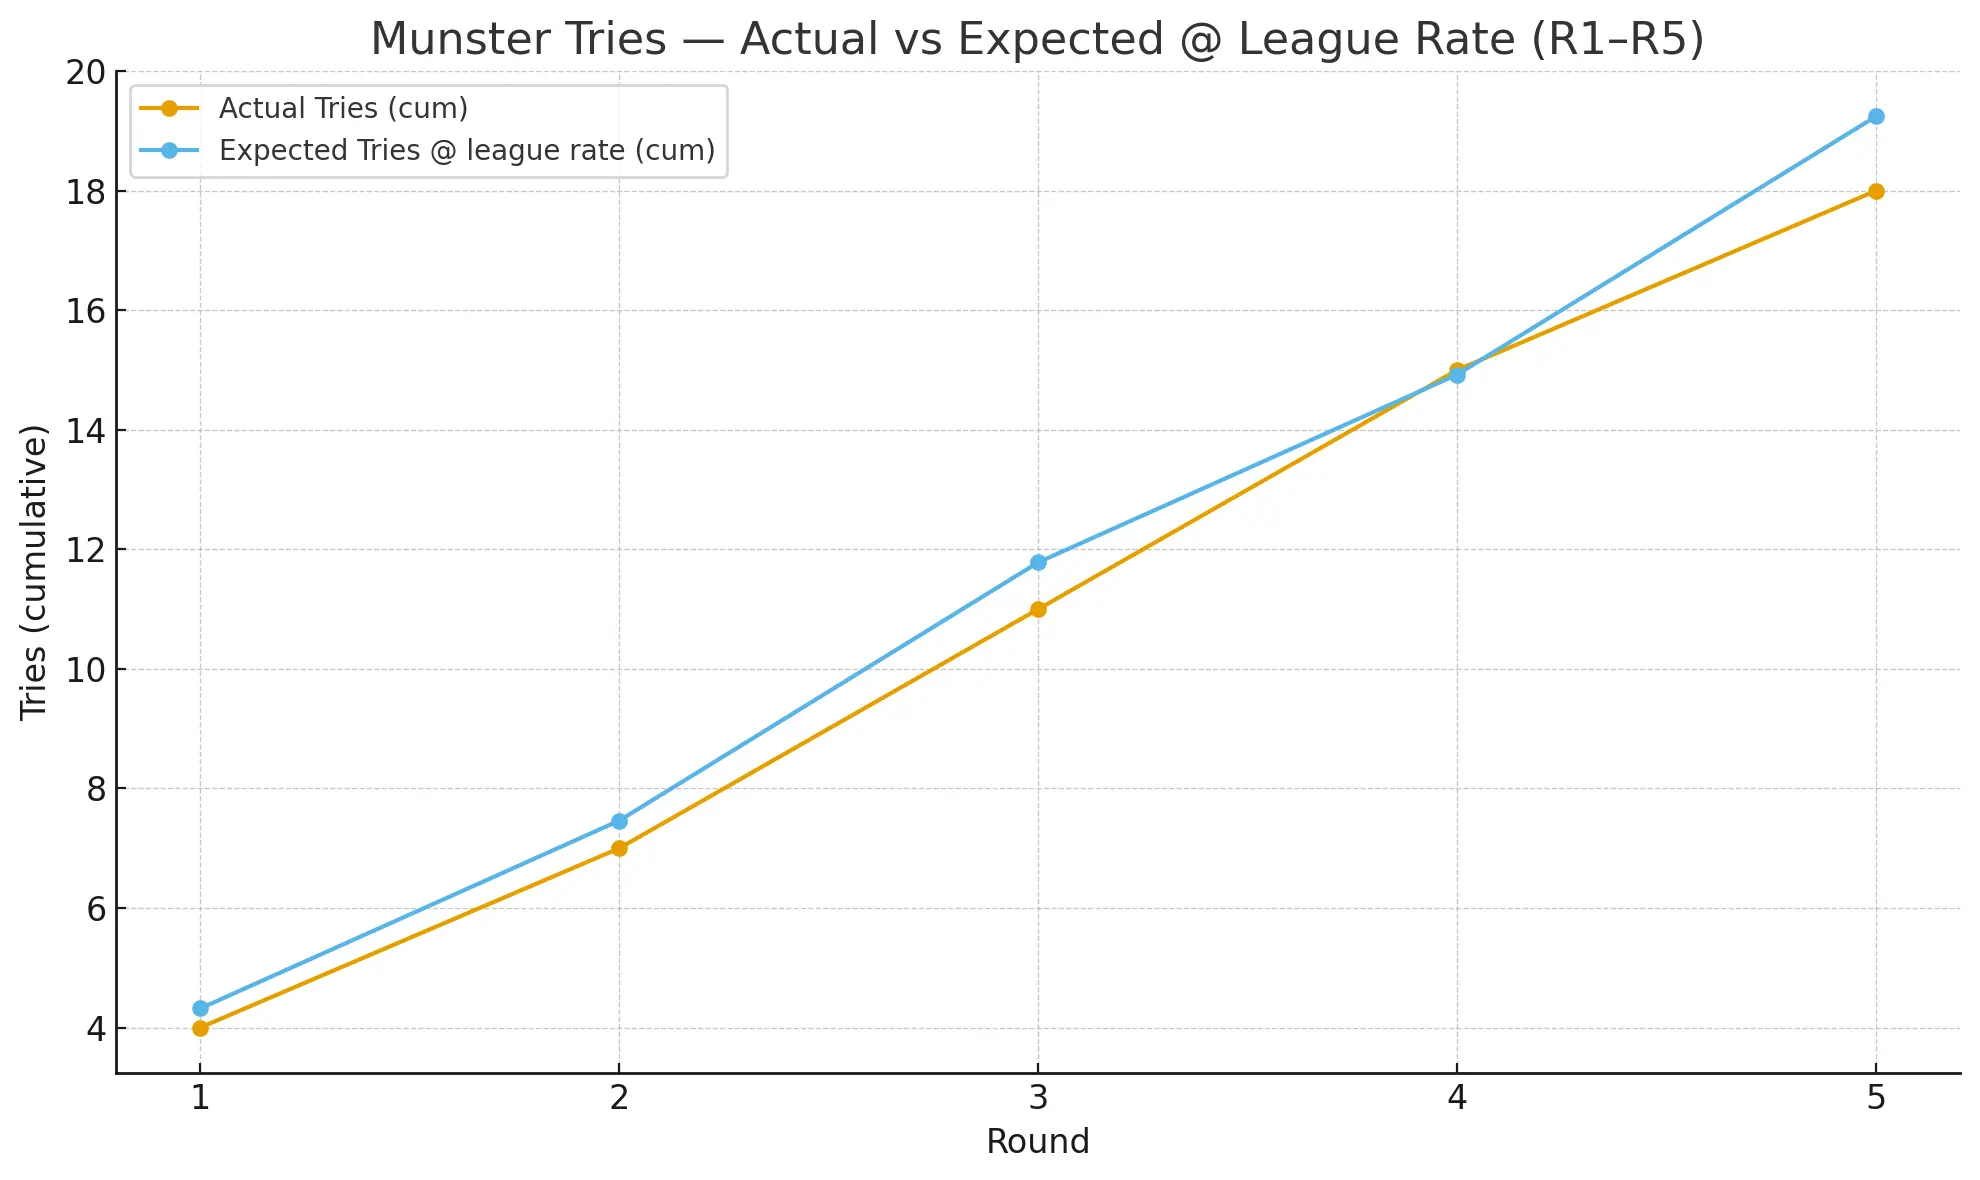
You can see this clearly when you look at the Tries Per Entry per Round graph, which shows the weather affected second and third rounds, and then that game against Connacht dragging down the numbers quite clearly.
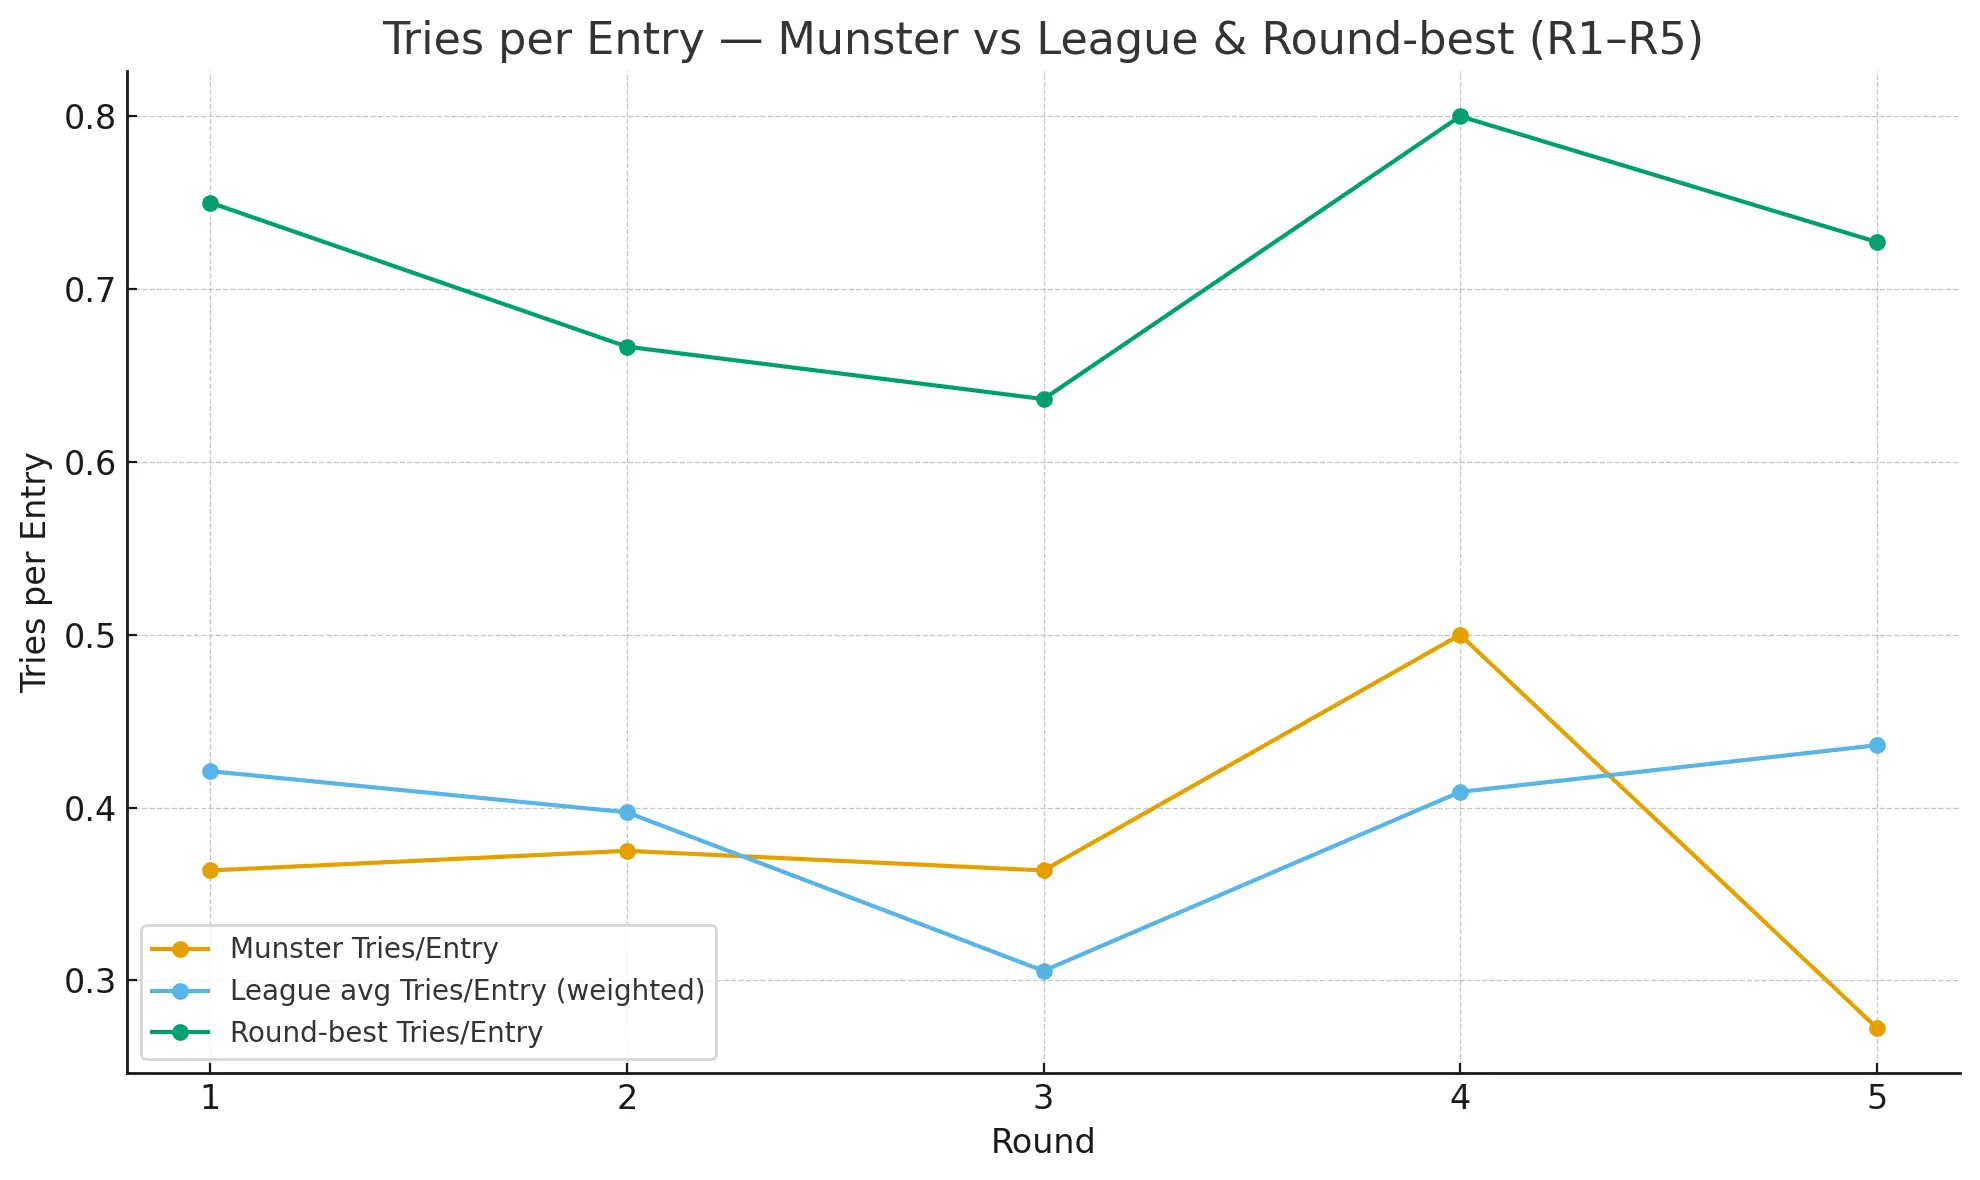
All in all, not great, but not bad either, especially when you consider we’re the only side with two hotly-contested interpros in the bag at this point of the season.
Now, let’s compare our other rankings to the rest of the league and highlight the current league leaders in those metrics.
| Metric | Munster | League Rank (of 16) | Leader | Notes |
|---|---|---|---|---|
| Entries (total) | 49 | 3rd | Glasgow (53) | High volume; only Glasgow (53) and Stormers (51) have more. |
| Points per Entry | 2.44 | 10th | Ulster (3.89) | League weighted avg ≈ 2.58 — Munster slightly under. |
| Tries per Entry | 0.367 (36.7%) | 10th | Ulster (0.576) | League avg ≈ 0.393 — a bit below the mean finishing rate. |
| LBR (linebreaks per ruck) | 0.0674 (6.74 per-100) | 6th | Stormers (0.1063) | Top-six for break rate; ceiling is evident (R4 spike), consistency is the gap. |
| Expected Tries (attack) | 19.24 expected vs 18 actual | — | League rate 0.3927 T/E | ~1.24 tries below expectation on 49 entries. |
| Expected Tries (defence) | 17.28 expected vs 15 conceded | — | League rate 0.3927 T/E | ~2.28 tries better than expectation on 44 opp entries. |
So offensively, we’re a little behind the current league leaders when it comes to 22 conversion. Ulster are top of the pile there with a massive 57% conversion rate. What does this mean? At the moment, Ulster are converting over half of their entries into tries, which is absolutely massive and something of an outlier.
Across a full season, the usual average for the very best sides is around 43% based on last year’s metrics, so you would expect Ulster’s averages to come down below that as the season progresses, but for now, it’s incredibly efficient, even allowing for the fact that they’ve played fewer games than the other teams at the top.
Defensively, we’re actually performing well above the baseline, which is a massive change from last season. We’re currently conceding a try on ~34.1% of the 22 entries we concede, i.e. one try every 2.93 entries. Last season, that number was floating around 50% for most of the season. If you want a shorthand metric for why we’re so much better this season than last season, it’s that.
Essentially, the improvement so far is almost completely defence-led.
You can get a good grip of who’s doing what with this table.
| Team | Entries | Pts/Entry | Tries/Entry | Entries Con | Pts/EC | Tries/EC | LBR/100 | LBR Con/100 |
|---|---|---|---|---|---|---|---|---|
| Benetton | 36 | 2.0 | 0.278 | 47 | 2.61 | 0.383 | 5.22 | 5.32 |
| Bulls | 40 | 3.29 | 0.525 | 40 | 3.51 | 0.525 | 7.12 | 6.7 |
| Cardiff | 40 | 2.67 | 0.45 | 37 | 2.07 | 0.297 | 6.03 | 5.32 |
| Connacht | 33 | 2.2 | 0.364 | 37 | 1.86 | 0.27 | 3.77 | 5.16 |
| Dragons | 29 | 2.34 | 0.345 | 42 | 3.51 | 0.524 | 4.16 | 5.39 |
| Edinburgh | 37 | 2.91 | 0.459 | 34 | 1.89 | 0.324 | 4.9 | 3.12 |
| Glasgow | 53 | 2.99 | 0.434 | 27 | 2.02 | 0.296 | 5.62 | 4.59 |
| Leinster | 46 | 2.62 | 0.413 | 41 | 2.94 | 0.463 | 7.86 | 10.47 |
| Lions | 38 | 2.54 | 0.395 | 38 | 3.13 | 0.474 | 6.88 | 8.77 |
| Munster | 49 | 2.44 | 0.367 | 44 | 1.98 | 0.341 | 6.74 | 3.98 |
| Ospreys | 41 | 2.6 | 0.39 | 47 | 2.82 | 0.447 | 6.08 | 5.75 |
| Scarlets | 36 | 1.51 | 0.222 | 42 | 2.73 | 0.405 | 5.28 | 11.48 |
| Sharks | 38 | 2.33 | 0.368 | 45 | 2.77 | 0.422 | 6.7 | 8.99 |
| Stormers | 51 | 2.64 | 0.392 | 34 | 0.87 | 0.118 | 10.63 | 4.85 |
| Ulster | 33 | 3.89 | 0.576 | 35 | 2.82 | 0.429 | 8.31 | 4.83 |
| Zebre | 34 | 1.95 | 0.265 | 44 | 2.99 | 0.455 | 6.27 | 7.71 |
It produces the following insights for us.
| Metric (R1–R5) | Munster value | League rank | Why it matters |
|---|---|---|---|
| LBR Conceded | 0.0398 (3.98 per-100) | 2nd | Opponents generate a linebreak only every ~25 rucks vs Munster — elite suppression of break events. |
| Entries (For) | 49 | 3rd | Access isn’t the problem: ~9.8 entries/game, top-end territory/pressure. |
| Points per Entry Conceded | 1.98 | 4th | Red-zone D is efficient; league weighted avg is ~2.58, so Munster are saving ~0.60 pts per opp entry (≈ 26 points prevented over 44 entries). |
What Does This Mean?
I had a look at where we landed in the top four from an underlying data perspective.
Elite break prevention: That 2nd-best LBR Conceded rate (3.98 per-100) is the backbone of Munster’s defence so far this season. It forces opponents to string phases rather than strike off single breaks, which in turn keeps Points/Entry Conceded low (4th) and Tries/Entry Conceded at a good level (0.341, 6th—just outside top-4).
Plenty of opportunity, conversion lagging: With 49 entries (3rd), Munster are getting to the red zone more than most; the drag is finishing (Pts/Entry 2.44, Tries/Entry 0.367, both ~10th). That’s why the overall scoring picture doesn’t match our access, but if we keep that volume pressure on entries up, conversion usually follows. As we’ve seen at test level, volume when it comes to entries matters.
Defence is carrying the margin: Versus league-average conversion, Munster have conceded ~2.3 fewer tries and ~26 fewer points in the red zone so far. That defensive over-performance currently offsets the attack’s under-conversion and has produced five wins from five. More on that below.
Near-miss top-4s:
Tries/Entry Conceded: 0.341 (6th best) — This is a good illustration of the red-zone defensive improvement, as we’re actually in the bottom six when it comes to 22 entries conceded. On last year’s average defensive performance in the red zone, we’d have lost three games to date.
- R1 at Scarlets (W 34–21, +13): 12 opp entries × 0.46 = 5.52 tries vs 3 actual → +2.52 tries ≈ +15 pts → likely flips to a loss.
- R2 vs Cardiff (W 23–20, +3): 8 × 0.46 = 3.68 vs 4 → −0.32 tries ≈ −2 pts → still a win.
- R3 vs Edinburgh (W 20–19, +1): 8 × 0.46 = 3.68 vs 3 → +0.68 tries ≈ +4 pts → flips to a loss.
- R4 at Leinster (W 31–14, +17): 11 × 0.46 = 5.06 vs 2 → +3.06 tries ≈ +18 pts → likely flips to a loss.
- R5 vs Connacht (W 17–15, +2): 5 × 0.46 = 2.30 vs 3 → −0.70 tries ≈ −4 pts → still a win.
If every other result in the league stayed the same, Munster would be 7th in the URC on 14 points, and not second on PD with 23 points. That’s a massive flip, and it’s entirely defence-led.
LBR (attack): 0.0674 (6th; top-six break creation). This is a big positive, especially when you consider that we’ve been without our primary scrum-half — Craig Casey — for four of these five games, and Jack Crowley for two of the scrappier games, Edinburgh and Connacht, where players like that can have a direct impact on conversion, especially with Thaakir Abrahams and Dan Kelly showing up really well for clean breaks (both in the top 10) in the URC.