


It won’t have escaped your notice that December and January have been hugely taxing for Munster, both in on-field performance and the consequences of those performances.
Out of the Champions Cup in January for only the third time, dropping from the top two to the top six. Not out of touch — thanks to the five from five buffer at the start of the season — but what wiggle room we had is now gone. It can still be made up, of course, but the momentum at the start of the season has warped into a more familiar feeling at the end of January. Creeping worries over systems, player fits, and clarity.

We’re not playing well, consistently, and the results are showing that clearly, with a clear regression from the first block that is turning narrow wins into narrow losses.
Let’s have a look at what the data shows us, and how we rank against the other URC teams.
Attack profile: carries, continuity, handling
Carry outcomes
Dominant carry %: 26.9 (15/16)
→ Munster are near the bottom for clear collision “wins”. That usually shows up as slower ruck ball, less front-foot for our shape — which is already flat — and less need for defences to fold in. In practice, what you’re seeing with our attack, like it has no space, is clearly expressed in this data point. We aren’t punching holes in the middle of the field near the ruck, where almost all of our carries are targeted.
Gainline success %: 55.7 (9/16)
→ Mid-table. We’re not “bad” at winning the gainline, but we’re not stressing defences with consistent front-foot either. In some ways, this is a “fake” gainline as teams are happy to concede a metre or so as long as they get a two-man stop eventually and a filled field on the next phase.
2+ tacklers engaged %: 49.8 (11/16)
→ Slightly low. We’re not forcing lots of multi-man tackles, which ties back to the dominant carry %. You’ll have noticed this on most of our carries — we rarely push teams above that two-man stop.
Evasion %: 15.2 (15/16)
→ This is the other big attacking flag: bottom-tier for beating defenders/avoiding contact. So we’re not winning collisions, and we’re not slipping them either. That equates to how compressed our screens look, and how flat our attacking shape looks when we go past 2/3 phases.
Breaks converted to tries %: 36.5 (7/16)
→ When we do punch a hole, we’re finishing reasonably well, but not at a rate to compensate for the other main attacking issues.
Net read: Munster’s attacking “problem” in these numbers isn’t chance creation at the far end — it’s how easy we are to defend phase-to-phase (dominance + evasion both bottom tier).
Offloads + handling
Offload success %: 82.4 (2/16)
→ Elite accuracy/decision-making on the pass itself. When we offload, the offloads stick. But…
Offloads leading to try/break %: 8.2 (13/16)
→ They’re not creating a lot of immediate damage. This usually means offloads are being used as continuity (keep the ball alive) rather than disruption (break the line/finish). That’s fine, but when combined with the lack of dominant carries it just looks like the same problems as last year — no penetration when we offload, and just a lot of scrappy recovery phases to get into another flat shape for another less than dominant carry.
Touches per error: 30.5 (8/16)
→ Mid-table ball security. Decent. Not bad, not good.
Net read: We’re a high-accuracy offloading team, but not a high-impact offload team.
I’ve combined all of this data into an overall Attacking Index to compare our metrics with the other URC teams, and it’s not great. I compared all of the available data on a weighted scale.
Here are the metrics I measured for the “Equal Weight” line, which assumes all of the data points above are of equal value.
I take 9 attacking metrics from the OPTA data:
- Dominant carries %
- Gainline success %
- 2+ tacklers %
- Evasion %
- Breaks → try %
- Offload success %
- Offloads leading to try/break %
- Touches per error
- % of Attacking Rucks under 3 seconds
Convert each metric into a z-score across the 16 URC teams (so every metric is on the same scale):
- 0 = league average
- + = above average
- − = below average
Rugby-realistic attacking index (the “stress-weighted” version)
What it is: The same composite idea, but it weights metrics in a way that I think reflects typical attacking priorities: creating advantage (stress) and turning it into damage.
How it’s computed:
Same 9 metrics, same z-scoring step (standardise vs league).
Instead of equal weighting, I applied this weighting split (sums to 1.00):
Primary advantage/stress creation
- Dominant carries % 0.18
- Evasion % 0.18
- Gainline success % 0.16
- % of Attacking Rucks under 3 seconds % 0.16
- 2+ tacklers % 0.10
Damage + payoff
- Breaks → try % 0.12
- Offloads leading to try/break % 0.12
Secondary support
- Touches per error 0.08
- Offload success % 0.06
What it tells us: “Who creates the most repeatable attacking advantage (dominance/evasion/gainline), and who turns that into outcomes (finishing/impact offloads), while still valuing possession security?”
Let’s look at the table.
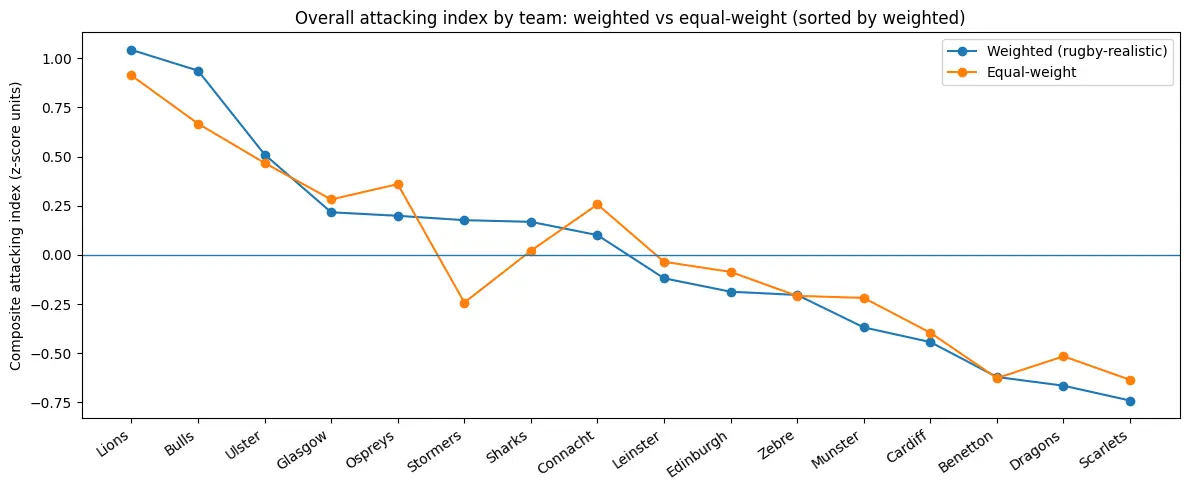
Now, you’ll notice that the teams doing really well on this metric aren’t necessarily the same teams that are in the top four or even top six. That’s where the defensive side of the ball comes in, kicking, combined with the x-factor of the set-piece. The Stormers and the Bulls have the biggest positive differential between the equal weight score and the rugby-specific metrics, with Ospreys, Connacht and ourselves in the same ballpark for negative differential.
What it says about Munster specifically
Munster sits 12th on the weighted line and 11th on the equal-weight line (both below 0). In practical terms:
- Munster are below league average on the overall attacking “ingredients” captured here.
- The weighted version has them a bit worse than the equal-weight version, which tells you something important:
Munster’s weaker areas are concentrated in the metrics the weighted model values most (the “stress” levers).
In Munster terms, the story is:
- We’re not getting enough repeatable advantage from dominance + evasion (the two things that bend defences), and we don’t have quick enough ruck possession to compensate.
- We do have positives that help our equal-weight score (e.g. clean execution/continuity elements), but those don’t move the needle as much when we weight toward what reliably separates elite attacks.
So, the attack can function, be tidy and relatively efficient, but on this composite data, it isn’t consistently forcing opponents into the kind of defensive compromise that drives top-end output, so too many of our possessions go nowhere.

What has to improve to move the needle (practically)
If we’re trying to shift from bottom-quartile output toward the top half, the biggest levers are:
- Raise dominant carry outcomes (through selection profile, carry roles, and collision setup)
- Add evasion/linebeat into the primary carry map (not just backfield/counter)
- Convert offload accuracy into offload damage (better timing, better support spacing, and more “through the line” rather than “behind the line” keep the ball alive offloads)
Ultimately, what this says is that we have a core problem; we have been nowhere near the team we want to be over the last few months, and it’s killing us. As I’ll show in a minute, we’re generally a very good defensive team — albeit one that has been hurt by individual mistakes in the last few months — but when those mistakes lead to an early deficit, we’re functionally incapable of pulling it back on the offensive side of the ball.
Here’s a weighted and unweighted defensive chart.
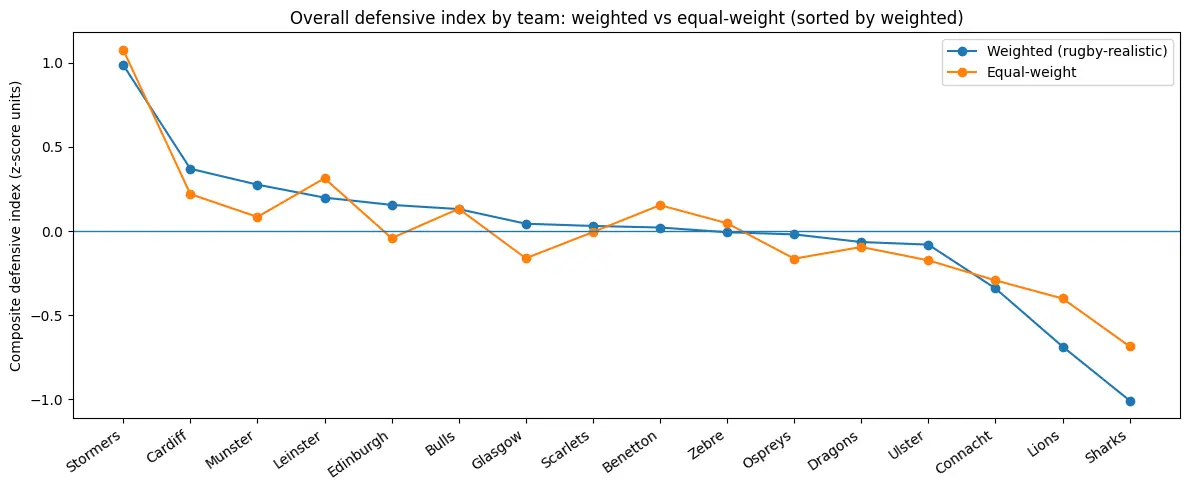
Munster’s core defensive identity: line control first
Munster are one of the better sides in the league for gainline denial (32.1%). That’s the base of everything: we’re not just making tackles, we’re stopping opponents from getting momentum. When that’s working, we force teams into longer, less profitable possessions where they have to earn every metre rather than being gifted it through soft contact.
That gainline control is backed up by a strong tackle success rate (89.6%). So the defensive picture is generally stable: we’re completing, we’re not leaking cheap metres, and we’re giving your set defensive line a chance to reset rather than scrambling constantly.
What separates us: genuine turnover threat
The standout “difference-maker” metric is rucks per jackal (28.5) — one of the best figures in the league on the OPTA data (lower = more frequent jackal events). That tells you Munster aren’t just defending to survive; we’re defending with an active aim to win the ball back.
That typically aligns with:
- good post-tackle picture (players landing square, tackler/assist getting up quickly)
- coordinated “second man” decisions (when to contest vs when to fold)
- confidence in the line behind the ball (you can’t jackal aggressively if your edge defence is fragile), even if that area has cost us incrementally in the last two months.
The defensive trade-off: dominance vs efficiency
We are mid-table on dominant tackles (4.9%). That suggests the system is less about headline collisions and more about efficient contact outcomes: stop the gainline, win the race to feet, and either fold or jackal depending on the cue.
We’re also lower on hips-or-below tackles (26.8%), which implies we’re not a heavy “chop-and-pounce” team compared to some others. Again, that fits the theme: it’s more line integrity + quick reload than a pure momentum-killing chop focus.
The “cost of a miss” is managed
Munster sit in a solid band on missed tackles leading to tries/breaks (27.5) (lower is better). So when a miss does happen, it’s not instantly catastrophic — until it is. That points to decent spacing, connected edge defence, and generally reliable cover layers.
The big weakness: 22 exits
The obvious red flag is 22 exit success (87.3%), which is low relative to the league. That’s not a small detail either; it’s a repeat-pressure problem.
In practical terms, it means Munster’s good defensive sets in their own red zone are not consistently converting into territory relief. So even when we defend well:
- We’re more likely to face repeat entries
- We accumulate fatigue, penalties, and “next mistake” risk
- We end up conceding points from volume rather than single moments
It’s also the one metric that drags our defensive composite down most sharply.
The overall read
Munster’s defence is fundamentally strong: it’s built on winning the gainline, completing tackles, and creating real turnover chances. That’s the profile of a side that can live with top opponents for long periods.
But the system is leaving points on the table by not consistently exiting cleanly from deep. Fix that, and the same underlying defensive quality starts turning into more “empty” defensive minutes for the opposition — and more possessions/territory for us. That exit success has dragged us down across the December/January block.
We’re a good defensive team that is heavily damaged by one or two defensive leaks because our attack can’t compensate for an early deficit.
When we look at both metrics together — offensive and defensive composite indexes — we see it very clearly.
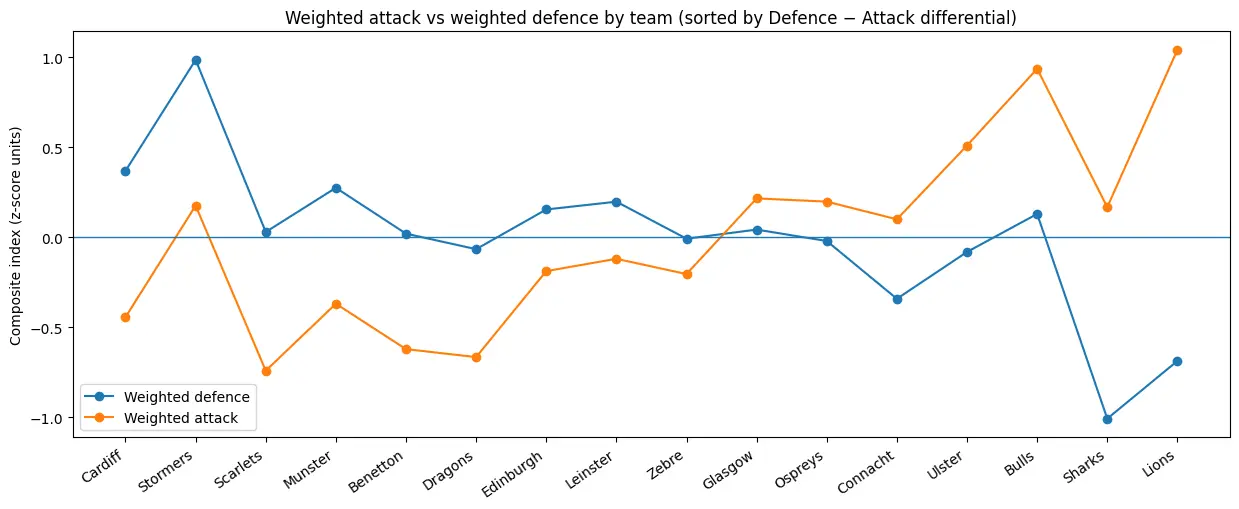
Most defence-led (highest Defence − Attack):
- Cardiff +0.813
- Stormers +0.810
- Scarlets +0.771
- Munster +0.644
- Benetton +0.642
Most attack-led (most negative Defence − Attack):
- Connacht −0.442
- Ulster −0.592
- Bulls −0.807
- Sharks −1.176
- Lions −1.730