


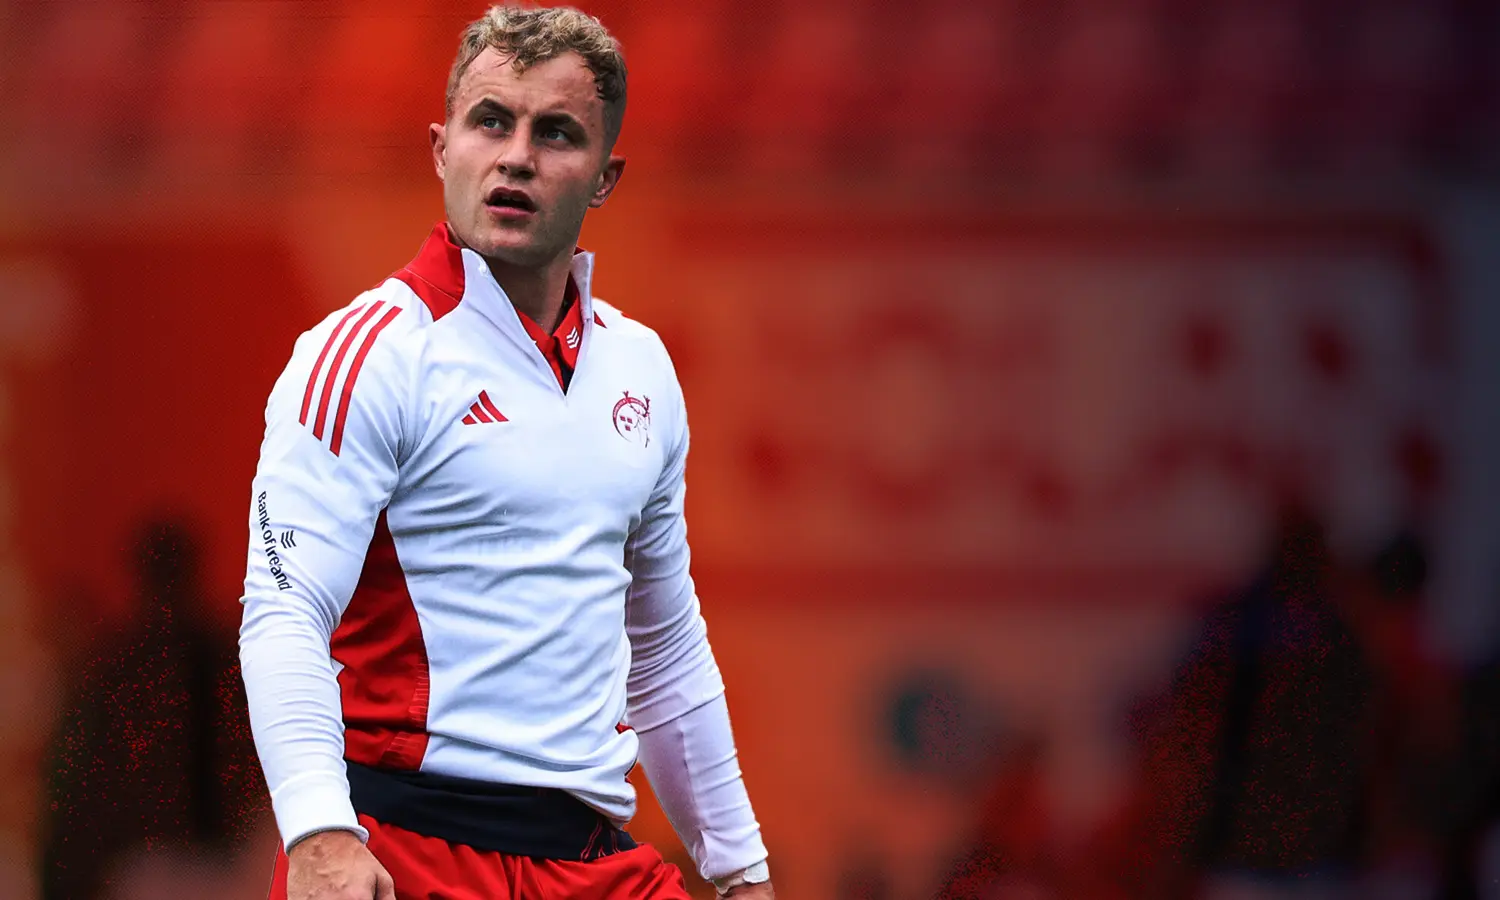
Scrumhalves are the canary in the coal mine of any attacking system. They touch the ball more than anyone; they feed possession into the system’s machine and live or die by the outcomes.
Craig Casey is the perfect example of that. Last season, Munster’s attacking system didn’t work well, and as a result, Casey’s effectiveness within it suffered.
For me, there is no argument that Casey is Munster’s second most important player when it comes to Munster playing well — it’s him, then Jack Crowley — certainly within the structures we’ve been playing for the last few seasons. He’s been a consistent matchday 23 regular for Ireland, if not always playing, and was rated high enough by the coaching group to captain last season’s tour of Georgia and Portugal when the Lions tour was on.
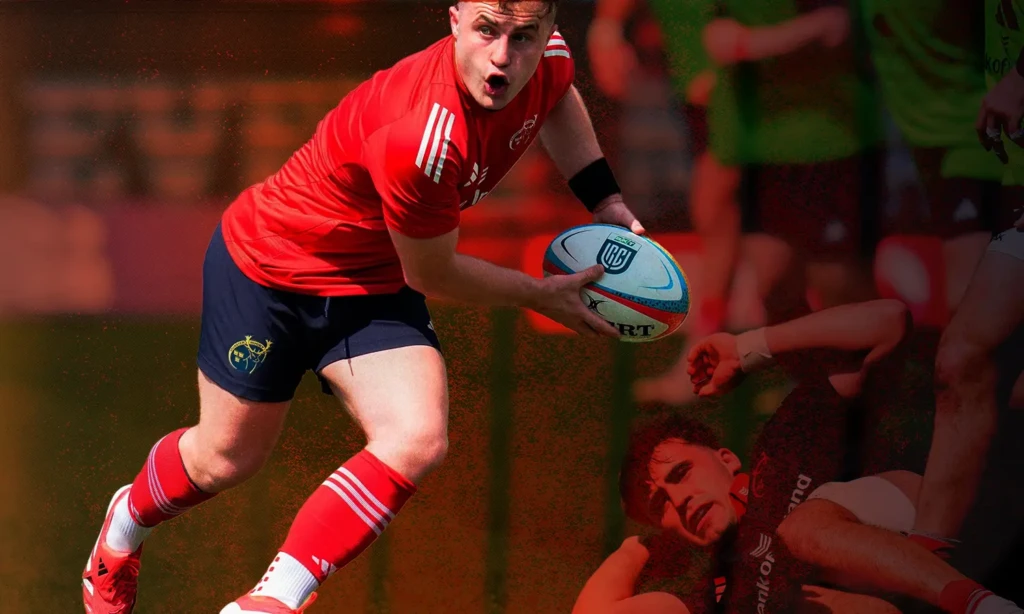
Yet, for many, Casey is considered an inherently disposable member of that Ireland squad that doesn’t quite fit his importance for Munster.
Sure, he’s a leader, a big character, a standard setter, and a player who brings energy and tempo, but what did last season show on the stat sheet?
URC 2025/26 · scrum-halves
One elite trait, one bad one, and a lot of average
Craig Casey measured against the median URC scrum-half on each metric, per 80 minutes. Bars run right where Casey is better than the median and left where he is worse — so for knock-ons and possessions lost, where a low number is good, the direction is inverted to keep right meaning better throughout.
Per-80 rates, URC 2025/26. Field is every scrum-half with a full statistical profile in the sample (n varies by metric, shown per row); Jamie Dobie excluded as he played roughly half the season on the wing, and Jake O’Riordan and Ben O’Donovan excluded on 19 and 42 minutes respectively. Casey’s own sample is 682 minutes across nine matches, the lightest of any established starter here.
URC 2025/26 · scrum-halves
Casey finishes chances he doesn’t create
Passes that directly put a teammate through a gap, against passes that directly produce a try. Casey sits in a corner almost nobody else occupies: near the top of the league for the final ball, at the bottom for the one that breaks the line. Nathan Doak is the only scrum-half genuinely high on both.
Per-80 rates, URC 2025/26, 20 scrum-halves. Linebreak assists count passes after which the receiver made a clean break. Casey’s figure represents roughly three or four passes across his 682 minutes, so treat the size of the gap with caution even though its direction is consistent.
URC 2025/26 · box kicking
Munster’s kick retention isn’t a Casey problem
The share of each scrum-half’s kicks from hand where his side kept the ball. Munster’s three nines land in a band four points wide at the bottom of the league — three different kickers, one outcome — which points at the chase and the contest rather than the boot.
Kicks retained as a share of kicks from hand, per player, URC 2025/26, 19 scrum-halves. Note this is not measured on the same basis as the team-level retention figure of 18.1% that ranked Munster fifth in the URC; the two denominators differ and should not be read against each other directly.
The outliers here are the knock-ons, and you can probably remember a few of those offhand. It has to be improved, without question.
The kicking is really context-dependent because it’s clear that (a) we don’t kick off #9 all that much regardless of who’s playing and (b) our retention rate on those kicks is low for all of them, which suggests it’s an issue with our chase, more than the kicks themselves.
So why did I feel like Casey’s season last year was below par?
Essentially, I went into Craig Casey’s data expecting to find a player having an average season inside a bad system.
That isn’t what’s there, necessarily. What’s there is stranger and, I think, more useful.
Let’s get to some other data, some of which shows what we already know.
Casey passed the ball 67.2 times per 80 minutes in the URC. The median URC scrum-half passed it 66.9 times. He made 83.6 attacking involvements per 80. The median is 83.6.
He is, on volume, exactly in line with other scrum-halves who played more than 520 minutes in the URC. He’s eleventh of twenty-one on pass volume, eleventh of twenty-two on attacking involvements.
The reason it looks like a collapse is that the names you instinctively measure him against — Horne, Afshar, Ben Murphy, Luke McGrath, Jamison Gibson-Park — are the top five in the league on those metrics. Comparing Casey to them and concluding he’s down is like comparing our ruck count to Glasgow’s and concluding we’re a kicking team. It’s a top-quartile sample dressed up as a benchmark.
So that’s one theory gone.
What Casey actually is, in numbers
Strip out the noisy data, and there are exactly three things in his profile that deviate meaningfully from the field.
| Metric | Casey | Field median | Rank |
|---|---|---|---|
| Try assists | 0.8 | 0.4 | 2nd of 21 |
| Passes | 67.2 | 66.9 | 11th of 22 |
| Attacking actions | 83.6 | 83.6 | 11th of 21 |
| Try-value created in open play | 0.7 | 0.7 | 10th of 20 |
| Possessions lost | 1.17 | 1.16 | 8th of 13 |
| Metres per kick | 21 | 23 | 16th of 19 |
| Kick retention | 17% | 19% | 12th of 19 |
| Kick metres | 219.7 | 271.1 | 16th of 19 |
| Linebreak assists | 0.4 | 0.75 | 17th of 20 |
| Knock-ons | 0.5 | 0.3 | 12th of 15 |
Elite at one thing. Poor at three. Exactly in the middle with everything else.
The one he’s elite at is try assists — second in the entire competition, behind only Doak. The one that should worry us is directly underneath it. Linebreak assists, meaning passes after which the receiver actually broke the line, and Casey is at the bottom of the league. Afshar 1.2. Morgan-Williams and Garbisi 1.0. Gibson-Park 0.9. Casey 0.4.
A scrum-half who is second in the URC at the pass that produces a try, and last at the pass that produces a hole.
Where have we seen that shape before?
We are watching our own club profile happen to one player.
In Part 4 of the Hard Reset series, I put us through the fifty-one-club filter and the column read like this: tenth for ruck speed, eleventh for taking possessions past five phases, thirty-sixth for gainline success, fiftieth of fifty-one for dominant collisions, forty-eighth for possessions producing a try or a break — and then eighteenth for converting linebreaks into tries.
We hold it, we recycle it, we don’t really create a ton of holes through our carrying, but we finish the ones we get.
Now line Casey up against that.
Where we’re good at getting and keeping the ball, he’s median. Where we’re forty-eighth of fifty-one at manufacturing a chance, he’s seventeenth of twenty at manufacturing one. And where we’re eighteenth of fifty-one at finishing, he’s second of twenty-one.
Every deviation in his profile points the same direction as Munster’s, in a general sense. That is either the most useful thing in our individual data or the least surprising, and I’ve been going back and forth on which for about a week.
Here’s what I’ve decided; it doesn’t prove anything, necessarily. A limited nine inside a limited system produces the same picture as a good nine inside a limited system. The shapes match; that’s all we can say from a spreadsheet.
But we don’t only have a spreadsheet.
We have the games, and the games have a mechanism in them that we can observe. So I watched all of Casey’s games back again.
The ball goes through nine. The danger goes through ten.
They don’t intersect as often as they should, and this is the part I keep coming back to.
Jack Crowley touched the ball 31.7 times per 80 minutes last season. Sam Prendergast, doing the equivalent job at Leinster, touched it 46.3 times per 80. Whatever we are, we are not a side that plays off our fly-half in any volume sense. Jack Crowley isn’t really an attacking hub; he is better described as an attacking intervention.
Casey passed the ball 67.2 times per 80. Crowley’s entire touch count from every source on the pitch in the URC — phase ball, kick receipts, passes off midfield, the lot — is 31.7. Even being generous, most of Casey’s passes are going somewhere other than his ten, whether that’s Crowley or Hanrahan. At Leinster, the same sum is 79.3 passes into a fly-half touching it 46.3 times, which is a far tighter relationship.
So where is Casey’s ball going? Into pods. Into the flat 1-3-3-1 I spent most of the third Hard Reset article complaining about, where the “first receiver” relative to Casey is most often three forwards standing in a line rather than the #10.
And that produces the split.
| Half-back pairing | Share of attacking actions from 9 | Share of linebreak assists from 9 |
|---|---|---|
| Casey + Crowley | 72% | 17% |
| Casey + Hanrahan | 68% | 57% |
| Gibson-Park + Sam Prendergast | 65% | 32% |
With Crowley on the field, Casey does very nearly three-quarters of the half-backs’ handling and supplies less than a fifth of their line breaks. Pass volume and creation are separated.
You can see why. Crowley registered 1.9 linebreak assists per 80, joint-best of any fly-half in the competition. That’s the whole creative output of our half-back unit sitting in one man’s hands, on thirty-odd touches a game, which is insanely efficient in one way, but limiting in another.
And then look at what happens without him.
Hanrahan passed it 27.6 times per 80 — nearly double Crowley — and produced 0.3 linebreak assists.
More distribution through ten. Almost nothing coming out of it.
Combine the pairings, and our half-backs create 2.3 line breaks per 80 with Crowley and 0.7 without. Leinster’s pairing produces 2.8. That is not a rotation issue or a form dip; that’s the difference between having a creator and having a distributor.
It also maps almost perfectly onto what I found in the second Hard Reset article — plus 0.60 net 22 efficiency with Crowley in the side, minus 0.78 without. I flagged then that the split reflected the schedule as much as the player. I’m less sure of that now. The mechanism is sitting right here: when Crowley isn’t playing, nobody in our half-backs can create a linebreak, and Casey isn’t set up to be the one who does within the system as it was.
So is the kicking his fault? Mostly, no.
This is where having our other nines thrown into the data matters, and it’s the cleanest finding I was able to determine.
| Label | Casey | Coughlan | Patterson |
|---|---|---|---|
| Minutes | 682 | 420 | 380 |
| Kicks from hand | 10.4 | 10.3 | 7.2 |
| Kick retention | 17% | 15% | 15% |
| Kick errors | 0.5 | — | — |
Three different scrumhalves kicking, one very clear outcome. Seventeen, fifteen, fifteen — a band barely four points wide, all of it below the league median of 19% and a long way off Gibson-Park at 26% or Aled Davies at 28%.
When we did kick to retain, it was mostly off first receiver.
When three separate scrum halves produce the same number, you’re not measuring those players anymore. Our box-kick retention problem is the chase and the contest, not the lads kicking it, and Casey happens to be marginally the best of the three at it.
Which sits perfectly well beside the point I made in the first Hard Reset article — sorry for all the references here, but it’s what got me thinking about this in the first place — that we kick well as a team and don’t kick enough.
The one thing that is his: kick errors. That’s a Casey number, not a Munster number, and if we’re going to kick more next season it’s the one to fix first, albeit with the proviso that Casey’s errors would have come in the higher-pressure, higher difficulty games, especially towards the end of the season when it seemed like the entire club was on fire.
The knock-ons need context too, but not an excuse.
Casey knocked on 0.5 times per 80, which is joint-second worst among URC nines. That looks bad, and it is bad.
But run it beside the rest of the backfield. Daly and Haley were first and second in the league for dropped balls per game and both in the top ten for handling errors. We were the only club with two players in the top ten for turnovers conceded. And Casey is passing into a shape where every pass and every carry has a defender in the throat of it, and everything demands the perfect catch.
His pass accuracy inside that is 98%. He threw no forward passes all season. He lost the ball in a ruck 0.1 times per 80. He gives up possession 1.17 times per 80, which is better than Gibson-Park at 1.49 and McGrath at 1.68.
He isn’t loose. He sometimes spills the ball when trying to tap and go quickly or when he gets scragged at the base of the ruck. Those are different problems with different fixes, and one of them gets easier the moment we play with more depth and, hopefully, more dominant collisions.
That translates to his running game, too, and where he runs within Munster’s system.
URC 2025/26 · carrying
Casey wins more collisions and gains less ground
Percentile rank for each carrying metric, per 80 minutes. Gibson-Park leads on everything to do with making ground — and trails on both measures of winning the contact. The two of them are not carrying in the same places.
Percentile rank, per 80 minutes, URC 2025/26. Dashed line marks the 50th percentile for scrumhalves with more than 520 minutes played.
If you want the clearest picture of what our shape does to a scrum-half, put Casey’s carrying next to Jamison Gibson-Park’s and watch where the two of them separate.
| Per 80 | Casey | Gibson-Park |
|---|---|---|
| Metres per carry | 2.9m (15th percentile) | 4.6m (72nd percentile) |
| Gain-line % | 46% (20th) | 60% (63rd) |
| Territory gained | 243.5m (36th) | 304.3m (74th) |
| Line breaks per carry | 0.13 (62nd) | 0.17 (74th) |
| Offloads per carry | 0.04 (28th) | 0.07 (51st) |
| Dominant carries | 0.7 (48th) | 0.4 (23rd) |
| Dominant carry % | 12% (41st) | 7% (17th) |
Start with the thing that isn’t a weakness, because it surprised me. Casey breaks the line more often than the average scrum-half in the URC — 0.13 breaks per carry, better than six in ten of his peers, and 0.8 clean breaks per 80 in raw terms. He isn’t a nine who can’t find a gap, or snipe. He finds them at a better rate than most, and he makes twice as many as he sets up for other people. He’s not a sniping machine like Gibson Park, or Dupont, or Horne, or Papier, but he doesn’t need to be that to be effective.
The problem is what’s on either side of the break. He makes 2.9 metres per carry against Gibson-Park’s 4.6 — nearly 60% less ground, every time he tucks it under his arm. He gets past the gainline on 46% of carries; Gibson-Park manages 60%, which is meaningful given they start on the gainline itself, more often than not. When he does get through, the ball dies with him: 0.04 offloads per carry against 0.07.
Part of that comes down to physics — Casey is a smaller, lighter player than Gibson-Park and a little slower off the mark. That pace and extra pop in contact are probably Gibson-Park’s hallmark. When Casey makes a break, he is more easily scragged and disrupted by recovering forwards, but that’s not the sole cause.
Look at the bottom two rows.
Casey wins the collision more often than Gibson-Park does. Dominant carries 0.7 against 0.4, a dominant carry rate of 12% against 7%. Casey is comfortably the more physically effective of the two in contact, and comfortably the less productive of the two beyond the line, right after the break.
There’s only one way that adds up. They aren’t carrying in the same places or the same context.
Gibson-Park is getting the ball with grass in front of him. He doesn’t need to win a collision because he’s mostly avoiding them — evade, accelerate, bank the metres, offload if the support’s there. Casey is going off the fringe into a defensive line that’s already set, occasionally ducking a tired forward, and getting stopped inside three metres because there was never anywhere to go.
Which brings us back to where we always end up. That’s not a lack of a running game from Casey. That’s a running game inside a flat system that isn’t producing dominant collisions for him to exploit with any regularity.
If you did nothing else but swap the scrumhalves, how would Casey look? Who would be the Irish incumbent? I think it’s more of a point than it might seem on the surface. We can’t separate the #9 from the pack in front of him, or the system they run.
So what does all that mean?
Casey is the volume hub of an attack that does its creating somewhere else, in a channel he mostly isn’t feeding, behind a pack that was fiftieth of fifty-one for dominant collisions. The majority of Casey’s pass action went to a forward unit that didn’t win collisions in any consistent sense.
He was a core part of Munster having really quick ruck possession — we had the fastest ruck recycle rate of all the URC teams, and Casey is a core part of that — but the problems came from what happened after the pass.
The players he passed to most often did not win collisions, which meant that the next pass became more pressured, which meant that the opportunities to create offence of your own through sniping were incrementally harder to generate.
That is not a role in which a nine accumulates linebreak assists. It’s a role in which he accumulates passes into forward pods and, when the opportunity finally presents itself, the killer last ball, which is his statistical signature, exactly.
It also explains what looked like a contradiction. Close to the line the pods and the space outside them are the scoring mechanism, and the final pass off the ruck is Casey’s — hence second in the league for try assists. Forty metres out, the pods are the absorbing mechanism, and the pass that matters belongs to Crowley — hence why Casey is bottom of the scrum-half league for line break creation.
Fix the depth, get a second playmaker working so the creation isn’t all in one pair of hands, and get the carries going forward, and Casey’s numbers should move. If it doesn’t, we’ll know something we don’t currently know, but I think they will.
We don’t need Casey to become a different player. The player that’s there now has all the ingredients to step another few levels as he enters his prime in the right system, as long as that system is producing dominant collisions. He has all of the consistency, accuracy and athletic game to be a valuable on-field guy for Ireland, which he currently isn’t, but that has to start at Munster, and he can’t do that alone.
No scrumhalf, other than maybe Antoine Dupont, can do that. Nathan Doak is the clearest example.
Doak created more linebreaks, marginally fewer try assists, and lost possession less often. Sure, that was in a system that played more off and through #9, but that only enhances the point. Look at Ulster’s collision work relative to ours.
Ulster crossed the gain-line on 43.6% of their carries last season. We managed 43.0%. Sixth and eighth in the URC. Functionally, the same number.
Now put the dominant contacts beside it. Ulster won a dominant contact on 17.8% of carries, second in the league. We managed 13.0%, thirteenth. In raw terms that’s 22.4 dominant contacts a game against our 15.6, off a carry count that’s within six per cent of ours — 125.8 to 119.9.
Carry the same number of times. Get to the gain-line the same amount. Win the collision 44% more often.
That is the whole thing, and everything else in their carrying profile falls out of it: 8.9 clean breaks a game to our 6.3, 25.6 defenders beaten to our 19.8, 407 post-contact metres to our 343.
There’s a difference between getting to the gain-line and dominantly arriving there with something left. Cross it flat-footed, and you get a neutral ruck — ball’s available, defence is set, everyone resets. Cross it dominant, and the tackler is going backwards, the cleanout is uncontested, and the ball is on the floor and gone before the far side of the defensive line has finished folding.
One of those gives a nine a platform. The other gives him a rotten job to do under pressure.
For too long, we have given Casey a game he can only play on the hardest setting. We need to give him more to work with, because the data says that when he gets it, he’ll thrive.
