


It’s time to revisit our Net Efficiency series after a break of a couple of rounds of URC and European action.
In the last article, right after the Leinster game, it was clear that Munster’s four wins from four to that point were being built on defensive solidity. But where are we now, four games later?
In short, a bit like your average incel, we’re heavily affected by Bath.
Let’s get into it.
The Season So Far
If we take the season on a two-game rolling Net Efficiency basis, we can start to see a statistical downturn from the Connacht game onwards.
| Block | Games | Net Entries | AE | DE | NE | |
|---|---|---|---|---|---|---|
| 1–2 | Scarlets + Cardiff | −1 | 2.92 | 2.02 | +0.90 | |
| 2–3 | Cardiff + Edinburgh | +3 | 2.22 | 2.40 | −0.18 | |
| 3–4 | Edinburgh + Leinster | 0 | 2.52 | 1.66 | +0.85 | |
| 4–5 | Leinster + Connacht | +3 | 2.34 | 1.76 | +0.58 | |
| 5–6 | Connacht + Stormers | +5 | 2.08 | 2.69 | −0.61 | |
| 6–7 | Stormers + Bath | +2 | 2.06 | 3.99 | −1.93 | |
| 7–8 | Bath + Gloucester | +16 | 1.76 | 4.43 | −2.67 |
Illustrating it on a graph looks like this. Be warned — there’s a big plunge here.
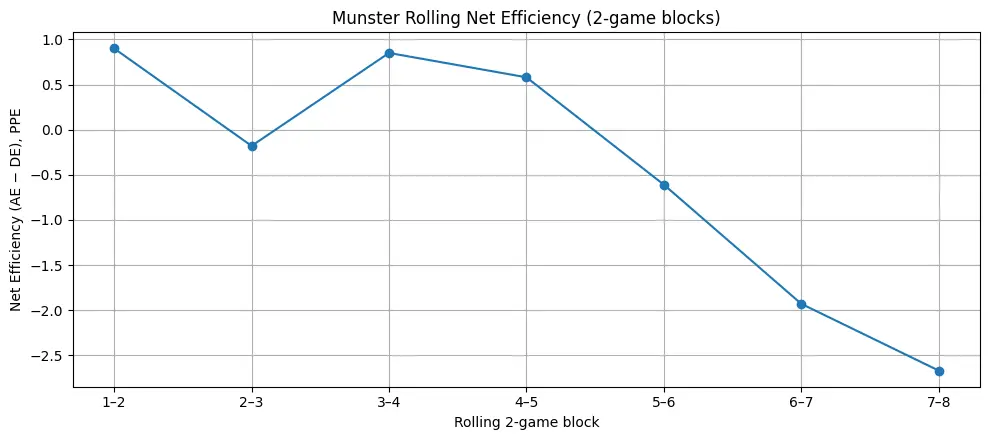
So what are we looking at?
The season splits cleanly into two phases. Across blocks 1–3 to 4–6, our rolling Net Efficiency stays positive (from +0.20 up to +0.69), which is the profile of a side generally winning the per-entry battle over sustained stretches.
The inflexion point is the loss to Bath entering the rolling window. The moment Bath appears (block 5–7), the rolling Net Efficiency collapses to −1.91, and it remains negative in 6–8 (−1.50). That’s not “noise”; it’s a structural hit to the model because Bath is an extreme opponent-efficiency outlier.
This is what “one red card match” looks like in efficiency terms. The magnitude of the drop (from +0.50 in 4–6 to −1.91 in 5–7) is precisely what you see when one fixture contains a major concession: it drags the whole short-term signal down even if the surrounding games are steady.
Gloucester stabilises the trend, but doesn’t fully repair it. Moving from 5–7 (−1.91) to 6–8 (−1.50) is an improvement, but we’re still negative because the block still contains that Bath loss. In other words, the win over Gloucester helps, but it can’t “outvote” the Bath efficiency swing inside a three-game window.
The early-season positive blocks suggest the base game is working. If we park Bath for a second, the model is telling us that over multiple URC windows, we’re living in the +0.2 to +0.7 range. That’s a healthy sign: we’re generally creating/finishing entries at a better rate than opponents across sustained stretches, not just single-match spikes.
If you remove Bath from the equation, the “formline” reverts to broadly positive. 4 of 6 rolling blocks are positive; the average rolling NE is +0.31. The trend becomes “mostly above water with two dips,” rather than “structurally red.”
Bath was the floor-breaker. With Bath included, our last two rolling blocks were deep negative; without it, the worst 2-game NE is only −0.61 (Connacht+Stormers). That’s a meaningful change in the story: from crisis-level outlier to normal volatility.
Without that Bath performance, our trend line looks like this;
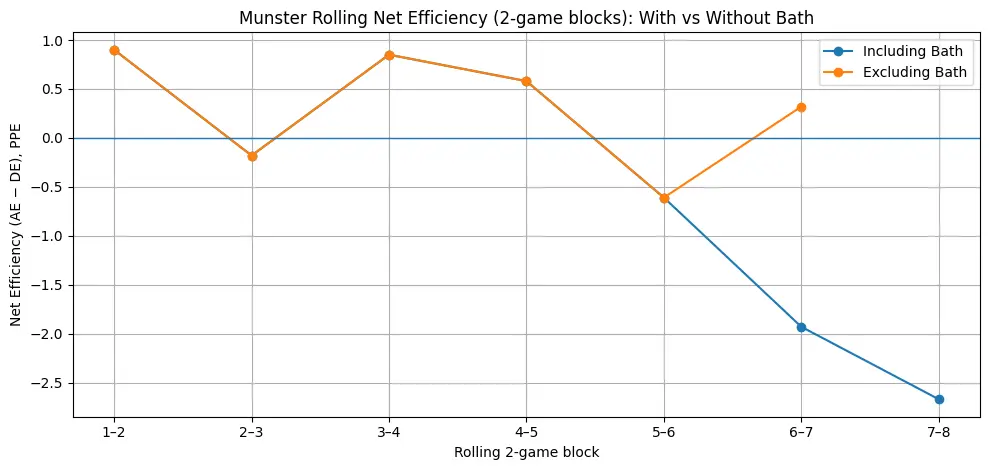
It’s a dip, rather than a killer trend line anchor.
I suppose what remains to be decided is whether it was the clear outlier it appears to be, or a warning sign of how low our floor is.
The short-term narrative is defence efficiency, not entry volume. Because our NE is defined as AE − DE, the sharp negative turn implies the defensive side of the equation (opponent PPE) is the main driver of the slump once Bath enters the sample. The problem in the model isn’t simply that we stopped generating enough entries; it’s that one opponent converted entries at an elite rate, and it’s the hole in the boat for a few games until it gets fixed, or not.

This is why rolling windows matter. A single-match table can tell you Gloucester was a huge win; the rolling table shows you a more honest truth: the performance band is still being shaped by Bath until we get more games “after” it in the sample.
What to watch for the Ospreys: if the next match is merely average on defensive efficiency, the Bath game will still be inside the rolling 3-game block, and our Net Efficiency will probably remain suppressed. The real “return to baseline” should appear only once Bath rolls out of the three-game window, and then we’ll see whether our underlying level reverts to the +0.2 to +0.7 band.
Attacking Conversion
After Gloucester and Bath, it became clear that our ability to convert opportunities is an issue that the coaching staff are hot on. Does that show up here?
Not in a “structural” sense. The rolling Net Efficiency trend says the bigger story is volatility in what we concede per defensive entry, with attack efficiency acting more like an amplifier when it dips, rather than the root cause every week. Remember, the aim of the game isn’t to generate 22 entries — it’s to win individual games.
If we remove Bath (the obvious outlier), our season profile is actually pretty stable:
- Attack Efficiency (AE): 2.40
- Defence Efficiency (DE): 1.98
- Net Efficiency: +0.42
That’s not the signature of an attack that can’t convert. It’s the signature of a team that, most weeks, is doing enough with entries — and winning the efficiency battle — provided our defence keeps opposition conversion in a normal band.
Attack isn’t separate from defence; it’s intrinsically linked to game state.
Where attacking issues do show up
On a rolling-2 basis, excluding Bath, the two negative windows have two different causes:
- Cardiff + Edinburgh (NE −0.18): this is the “attack goes a bit blunt” window. Edinburgh’s 1.8 PPE on 11 entries drags the block AE down, and we don’t get enough defensive edge back to offset it.
- Connacht + Stormers (NE −0.61): this is primarily a defence conversion problem (block DE 2.69), with attack also not helping (AE 2.08). That’s the classic pattern: when attack slips slightly, and defence concedes too cleanly, Net Efficiency turns negative fast.
So yes, at a basic level, there are matches where our Attacking Efficiency drops below the level we need, and that’s a real lever, but it’s not the consistent, season-defining failure it might seem to be after the first European bloc.
What the Bath distortion really tells us
When Bath is included, the rolling windows fall off a cliff because our Defensive Efficiency explodes (we’re conceding points per defensive entry at an extreme rate). Even if we’d posted an average AE that day, the model would still hate it — because you can’t carry a defensive conversion line like that for long without the whole NE trend collapsing.

So what does this mean in practice?
The model doesn’t point to “attack is broken.” It points to this:
- Keep our AE out of the danger zone (the low-PPE games like Edinburgh/Connacht are the ones that start negative windows).
- But the bigger priority is to cap opponent PPE — because when Defensive Efficiency spikes (Bath, and to a lesser extent Connacht/Stormers windows), it overwhelms everything else and drags the rolling formline into red.