


With the first two games of the season in the bag, and a third to follow on Friday night, I thought it might be a good time to check in on Munster’s Net Efficiency trends as McMillan’s structure takes hold.
As a quick refresher, this is how I’ve defined my Net Efficiency metric.
Net Efficiency & Rolling Average — Plain-English Explainer
What is Net Efficiency?
Net Efficiency tells you how much a team gains (or loses) on the scoreboard per-22 entry, after accounting for both attack and defence.
Formula (per game):
-
Attack efficiency (pts/att entry): how many points you score each time you reach the opposition’s 22.
-
Defensive efficiency (pts conceded/def entry): how many points you allow each time the opponent reaches your 22.
-
Net Efficiency: the per-entry scoreboard edge.
-
Positive = you’re winning the per-entry battle.
-
Negative = they’re more efficient than you per visit.
-
Quick Examples
-
Munster vs Scarlets (2025/26):
-
Attack: 3.0 pts/entry on 11 entries
-
Defence: 1.7 pts conceded/entry on 12 entries
-
Net Efficiency = 3.0 − 1.7 = +1.3 (Munster win the per-entry battle comfortably)
-
-
Munster v Cardiff (2025/26):
-
Attack: 2.8 pts/entry on 8 entries
-
Defence: 2.5 pts conceded/entry on 8 entries
-
Net Efficiency = 2.8 − 2.5 = +0.3 (tight edge per visit)
-
Tip: If both teams have equal entries, Net Efficiency almost predicts the margin by multiplying by entries.
E.g., +0.3 net × 8 entries ≈ +2.4 pts of “efficiency edge.”
Why Net Efficiency is useful
-
Separates quality from quantity. It doesn’t reward empty visits or long possession without red-zone pay-off. I think it clarifies possession stats into something tangible, and I’ll be using it to cross-reference my new LBR metrics on the Work Rate series.
-
Comparable across opponents. Normalising by entries makes a 5-entry game and a 15-entry game comparable.
-
Actionable levers. You can win by (a) improving strike rate, (b) tightening red-zone defence, or (c) changing entry volume. The metric shows which lever moved.
What is a Rolling Average?
A rolling average smooths game-to-game noise so you can see the trend rather than one-off spikes.
-
2-match rolling: average of this game and the previous one.
- 3-match rolling: average of this game and the previous two.
I’ll be using a 3-match rolling average this season, as I think it gives you finer details to work with.
Why use it?
-
Reduces volatility. One weird game (red card, storms, rotated team) won’t whip the line all over the place.
-
Reveals form. A steady climb above zero = improving per-entry outcomes; a drift below zero = trouble in red-zone attack/defence.
How to read the charts
-
Per-game dots/line: exact Net Efficiency for each match (spiky).
-
Rolling line: smoothed trajectory
-
Above 0: across recent games, we’re gaining points per entry.
-
Below 0: we’re losing points per entry.
-
-
Season boundary line: helps you compare last season’s trend vs the new season’s start.
Practical thresholds (rules of thumb)
-
Attack ≥ 3.0 pts/entry and Defence ≤ 2.0 pts/entry → you’ll win most games, even with equal entries.
-
Net Efficiency ±0.8 per entry is a big swing. With ~10 total entries, that’s ~8 points of “per-entry” edge.
-
Entry parity matters. If entries are equal, Net Efficiency decides it. If entries aren’t equal, volume can overwhelm small efficiency gaps.
Common pitfalls
-
Tiny sample of entries. With 3–5 entries, one bounce of a ball skews the number — that’s why I use the rolling line to judge form, rather than looking at something like a one-off try concession that loses a game.
-
Ignoring entry differential. A small negative net can be offset if you create many more entries (and vice versa).
-
Opponent context. Against tier-2 teams, you’ll often post inflated attack efficiency; use rolling averages to keep perspective.
Turning insights into something useful
If Net Efficiency is negative because…
-
Attack is low (≤ 2.0 pts/entry): improve first-phase strike, maul threat, and set-piece starters; reduce wasteful phases before the 22.
-
Defence is high (≥ 3.0 conceded/entry): fix goal-line spacing/folds, slow opposition ball in the 22, prioritise exits that avoid repeat entries. That last point was a killer for Munster last season.
-
Entry counts are low: kick/territory plan to gain more starts in the opposition half; target +2 entries as a benchmark.
Net Efficiency is your per-visit scoreboard edge; the rolling average shows whether that edge is getting better or worse over time — so you can tell if performance is a real trend or just a one-off spike.
With that out of the way, here’s how we’re looking relative to the tail end of last season, with the last three games of 2024/25 rolled in with the start of 2025/26.
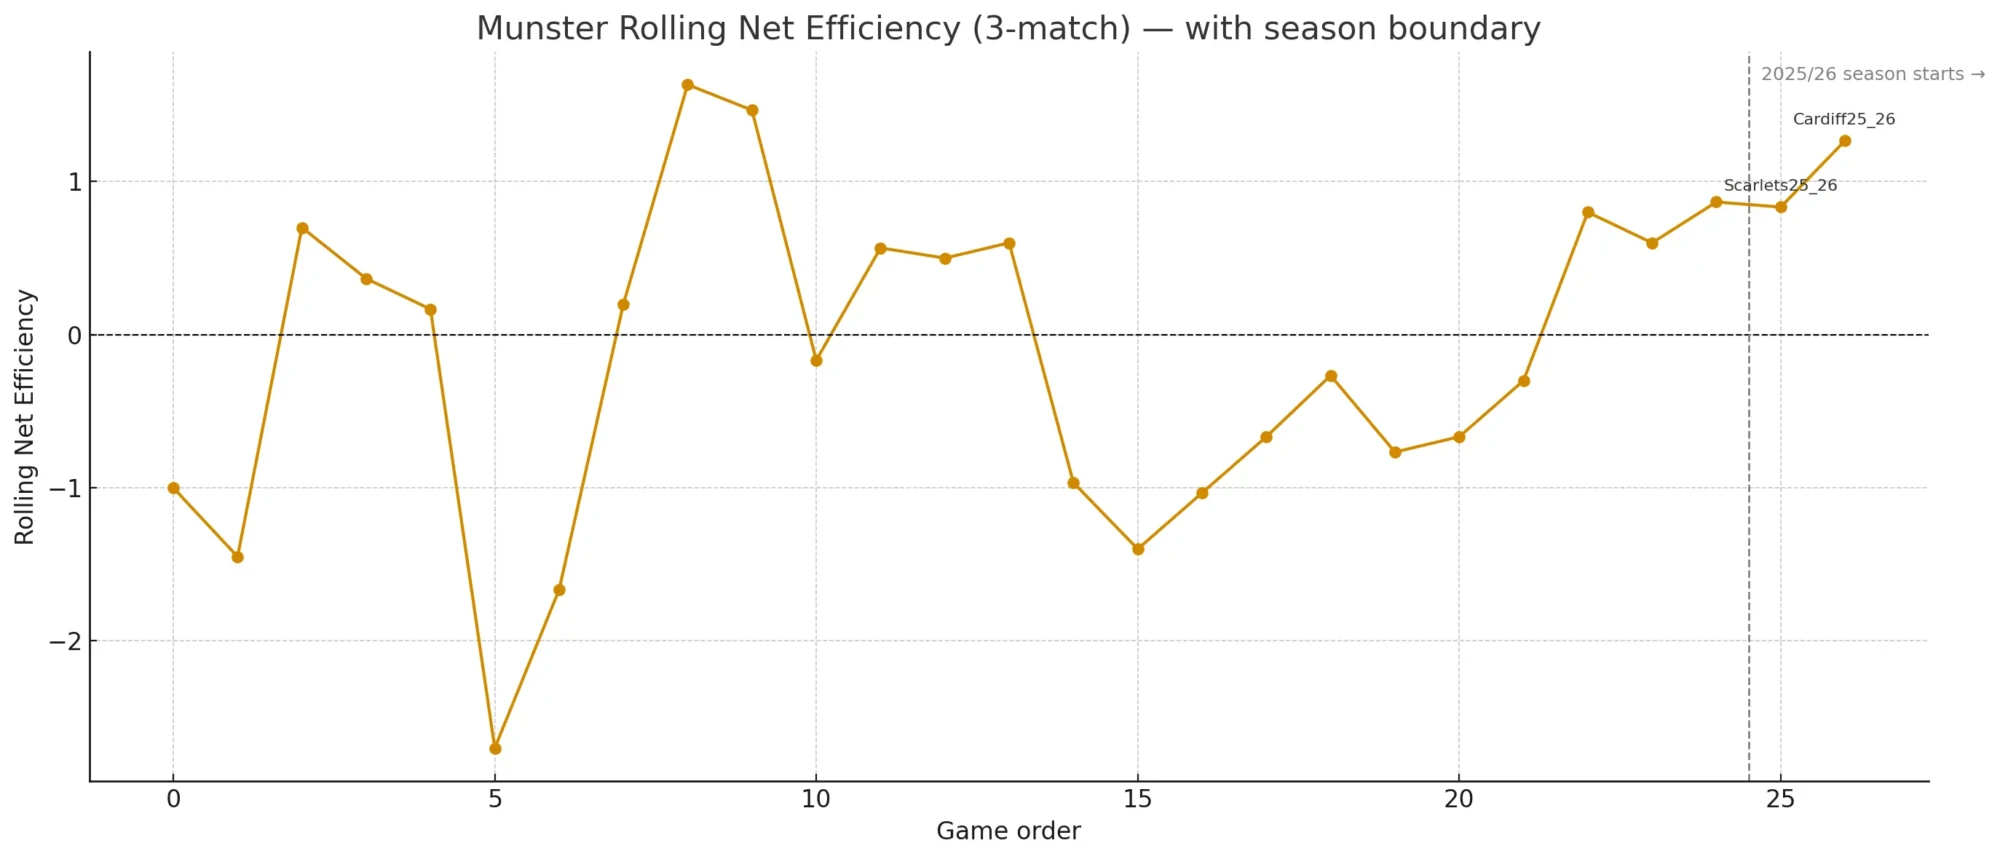
On the whole, it’s looking very positive.
Here’s a tight, numbers-first read on Munster’s first two games of 2025/26, set against last season’s baseline and the end-of-season trend you had.
What happened (per-entry focus)
| Game | Att entries | Pts/att entry | Def entries | Pts conceded / def entry | Net eff. |
|---|---|---|---|---|---|
| @ Scarlets (34–21) | 11 | 3.0 | 12 | 1.7 | +1.3 |
| v Cardiff (23–20) | 8 | 2.8 | 8 | 2.5 | +0.3 |
Model vs Scoreboard:
- Scarlets: 11×3.0 − 12×1.7 = +12.6 expected → actual +13.
- Cardiff: 8×2.8 − 8×2.5 = +2.4 expected → actual +3.
Our per-entry model is tracking the outcomes almost perfectly.
Context vs last season
| Metric | 2024/25 avg | Last 5 of 24/25 | 2025/26 (2 gms) |
|---|---|---|---|
| Attacking entries | 8.56 | 7.2 | 9.5 |
| Pts / attacking entry | 2.88 | 3.38 | 2.90 |
| Defensive entries conceded | 7.56 | 8.2 | 10.0 |
| Pts conceded / defensive entry | 2.98 | 2.66 | 2.10 |
| Net efficiency | −0.09 | +0.72 | +0.80 |
Key Reads
- Defence is the story. Concessions per opposition entry have dropped from 2.98 → 2.10. That’s a huge swing and the main reason Net Efficiency is +0.80 despite conceding more entries (10.0 vs 7.56 last year).
- Attack is steady, not spiky. 2.9 pts/entry is almost bang on the 24/25 average (2.88) and a little below the late-season hot run (3.38) that got us into the playoffs. We won Scarlets/Cardiff because the goal-line defence improved, not because the attack suddenly caught fire.
- Template wins without volume.
- Scarlets: we lost the entry count (11–12) but won big via 1.7 conceded/entry.
- Cardiff: entry parity (8–8) → the small +0.3 per-entry edge decided it.
What’s Working
- Red-zone defence: 2-game average 2.10 conceded/entry. That’s the best stretch compared with any 2-game window at the end of last season (last-5 avg 2.66).
- Attack conversion is resilient: ~3.0 pts/entry in both games with different profiles (volume win vs Scarlets, parity vs Cardiff).
- Per-entry model reliability: “Expected margin” from entries and efficiencies is within ~0.6–1.0 points of the real results across both games — this is excellent when it comes to week-to-week planning.
Danger Points
- Entry volume against is high: 10.0 opp entries/game so far vs 7.56 last season. If defensive concessions regress toward 2.8–3.0, margins will evaporate.
Target: bring opposition entries down toward ≤ 8 while keeping concessions ≤ 2.2. - Attack ceiling not yet tested: At 2.9 pts/entry, we’re winning, but the late-season benchmark (3.3–3.5) is what separates comfortable wins from coin-flips when we have entry parity.
Benchmarks for the next 3 games
- Maintain: Pts conceded/entry ≤ 2.2
- Lift: Pts/att entry ≥ 3.1
- Squeeze: Opp. entries ≤ 8 (from 10.0)
- Resulting net goal: +0.9 per entry (gives ~+7–9 pts edge in a typical 8–10 entry match)
Two rounds in, our improvement is defence-led: we’re allowing far fewer points per opposition visit to the 22, which is why we won big at Scarlets despite losing the entry count and managed to edge a tight, entry-parity game vs Cardiff.
If we can keep the concessions down and trim opposition entries, the early +0.80 NE trend is sustainable.