

It’s been a while since I’ve done a Work Rate article.
In truth, I began to lose faith as to whether or not the metric was of any value. What is a ruck, anyway? What is it worth? It’s hard to say, to be honest, because some rucks are far more valuable than others. I tend to get lost in the weeds with this stuff, especially if I think I’m wasting your time.
Last season, I was breaking down the ruck work into five-minute segments and calculating that across multiple games, and it provided a lot of detail, but after a while, I wasn’t quite sure about what that detail actually was.
It showed how Munster and Ireland hit rucks, who hit rucks, and how effective they were at doing that on a weighted basis. That, on its own, is useful, but what does it actually tell you? Nothing concrete, I decided.
But it made me think about rucks a little bit more. I’ll tell you what I found later in the article. Up first, our Offensive Ruck Work scoring for the first URC game of the season.
Munster’s OFFENSIVE RUCK WORK SCORE vs Scarlets
- A Dominant Clean is an action that decisively secures possession or that puts the defending player on the ground and keeps them there. It is worth 3 points.
- A Guard Action is where a player plays a role in helping to retain possession and is either securing against a counter-ruck or making sure the players we’ve put on the ground stay there. Let’s assign this action 2 points.
- An Attendance can be anything from adding a bit of bulk to ward against a counter-ruck to extending your leg to make space for a box kick. I’m marking this down as being worth 1 point.
- An Ineffective Action is a blown cleanout, a lean, a breakdown penalty or an action that I couldn’t see any direct benefit for. This will be worth -2 points.
| Dominant Clean | Guard Action | Attendance | Ineffective | Ruck Work Score | |
|---|---|---|---|---|---|
| 1. Loughman | 2 | 9 | 1 | 25 | |
| 2. Scannell | 1 | 9 | 21 | ||
| 3. Jager | 4 | 11 | 1 | 1 | 33 |
| 4. Kleyn | 2 | 8 | 3 | 1 | 23 |
| 5. Wycherley | 14 | 5 | 33 | ||
| 6. O'Donoghue | 4 | 12 | 1 | 37 | |
| 7. Kendellen | 3 | 9 | 1 | 25 | |
| 8. Gleeson | 2 | 9 | 24 | ||
| 9. Casey | 1 | 2 | |||
| 10. Hanrahan | 0 | ||||
| 11. Abrahams | 2 | 4 | |||
| 12. Nankivell | 1 | 7 | 17 | ||
| 13. Kelly | 1 | 7 | 17 | ||
| 14. Daly | 2 | 4 | |||
| 15. Haley | 7 | 14 | |||
| 16. Barron | 1 | 2 | 7 | ||
| 17. J. Wycherley | 6 | 12 | |||
| 18. Bartley | 3 | 6 | |||
| 19. Ahern | 1 | 2 | 7 | ||
| 20. Coombes | 1 | 5 | 13 | ||
| 21. Patterson | 0 | ||||
| 22. Crowley | 0 | ||||
| 23. O'Brien | 3 | 6 |
Highest ORW Scorers vs Scarlets
| Player | Ruck Score |
|---|---|
| O’Donoghue | 37 |
| Wycherley | 33 |
| Jager | 33 |
| Kendellen | 25 |
| Loughman | 25 |
| Gleeson | 24 |
| Kleyn | 23 |
| Scannell | 21 |
| Nankivell | 17 |
| Kelly | 17 |
| Haley | 14 |
| Coombes | 13 |
| J. Wycherley | 12 |
| Barron | 7 |
| Ahern | 7 |
| Bartley | 6 |
| Abrahams | 4 |
| Daly | 4 |
| O’Brien | 3 |
| Casey | 2 |
Munster’s overall ORW scoring came to 330 for the game, averaging 2.56 actions per ruck — this indicates that we were hitting rucks in two-man bursts, which was evident simply by watching the game and observing the narrowing of Munster’s forward formation.
We had a pretty low amount of rucks relative to some of the games from last season, but our efficiency per ruck was way higher than normal. Again, to be expected. When we visually break down the individual scoring, we see really strong performances from O’Donoghue, Jager and Kendellen, with a very busy performance by Fineen Wycherley.
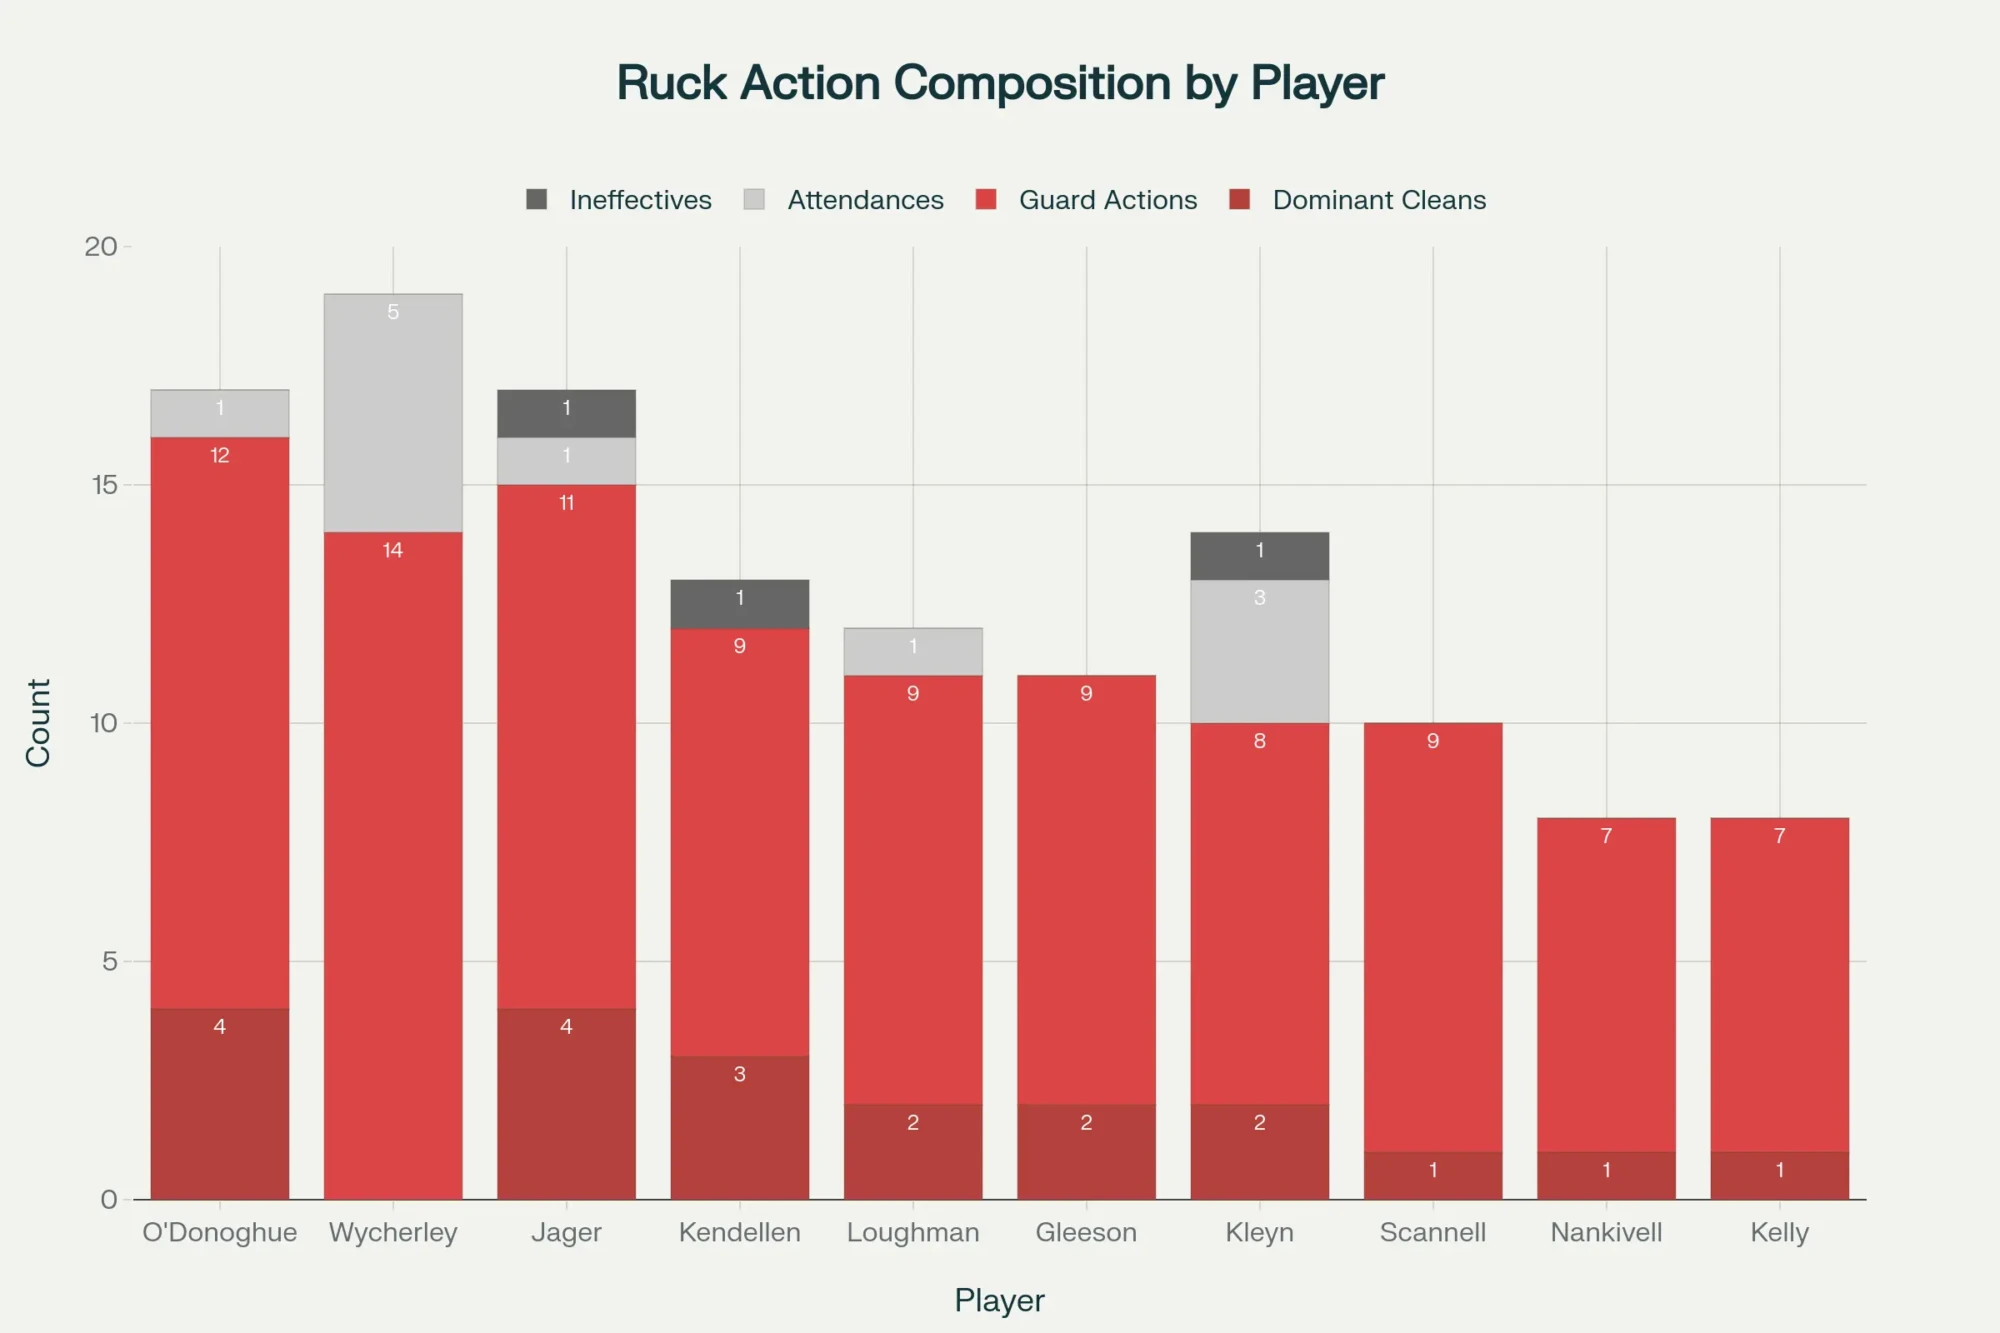
As expected, Nankivell and Kelly were very, very busy at the ruck, and those numbers will only increase in higher ruck volume games, you’d have to assume. Kelly, in particular, was hugely efficient with his entries and secured wider one-man rucks really well. All good there.
Seeing all eight starting forwards filling the top of the chart in a sub-90 ruck game is, again, a side effect of the narrowing of that forward line and is quite encouraging for the scalability of what we’re doing in the forwards this season.
***
In the latest For Every Wall A Hammer article, I went looking for what Rugby League teams use to judge the quality of their attacking play, and I came across a metric I don’t really see used in Rugby Union analysis all that often — PTBs x Linebreaks. Play The Balls, as I showed in that article (right here, on the €10 tier), are a direct systemic analogue for rucks. So, when comparing Munster’s attacking work — and, indeed, all attacking work — I thought it might be useful to start tracking that as an attacking metric as part of these Work Rate articles. After all, rucks aren’t just there for their own sake; they have to lead to something. Linebreaks are the most reliable indicator of attacking efficiency, and if rucks are the method through which most teams move up the pitch in settled play… that metric makes sense to me.
So if we rank that metric after the first weekend, we find the following;
Ranked Linebreak Per Ruck (LBR) Results
| Rank | Team | Rucks | Linebreaks | LBR | Per 100 rucks |
|---|---|---|---|---|---|
| 1 | Munster | 70 | 10 | 0.1429 | 14.29 |
| 2 | Ospreys | 60 | 8 | 0.1333 | 13.33 |
| 3 | Stormers | 69 | 9 | 0.1304 | 13.04 |
| 4 | Cardiff | 77 | 9 | 0.1169 | 11.69 |
| 5 | Leinster | 49 | 5 | 0.1020 | 10.20 |
| 6 | Glasgow | 90 | 8 | 0.0889 | 8.89 |
| 7 | Ulster | 113 | 8 | 0.0708 | 7.08 |
| 8 | Sharks | 104 | 6 | 0.0577 | 5.77 |
| 9 | Bulls | 88 | 5 | 0.0568 | 5.68 |
| 10 | Benetton | 101 | 5 | 0.0495 | 4.95 |
| 11 | Dragons | 48 | 2 | 0.0417 | 4.17 |
| 12 | Scarlets | 103 | 4 | 0.0388 | 3.88 |
| 13 | Lions | 75 | 2 | 0.0267 | 2.67 |
| 14 | Zebre | 47 | 1 | 0.0213 | 2.13 |
| 15 | Connacht | 117 | 2 | 0.0171 | 1.71 |
| 16 | Edinburgh | 62 | 1 | 0.0161 | 1.61 |
Notes
-
Values are rounded to four decimals for LBR and two decimals for the per‑100 metric.
-
LBR provides a possession‑volume‑adjusted lens; per‑100 rucks is included for easier interpretation across teams.
Last season, based on the approximate LBR, I was able to calculate across the European Cup and URC — the ruck counts are not exact here, so I had to amalgamate — Munster’s approximate LBR per 100 rucks was 8.08 or, approximately, a linebreak every 12.37 rucks.
Against the Scarlets, that was one linebreak every 7 rucks — an immediate and startling improvement. Obviously, we’ll have to keep track of this, but the initial signs are good.