
Ireland’s World Cup opener against Japan is almost upon us, so I decided to get something of a “health check” on where we are. One mistake that I think a lot of pundits and analysts make is that the women’s code is fundamentally different to the men’s in almost every single instance.
Sure, the importance of a good set piece is the same, but the entire meta of playstyles and game states is entirely different. For example, you tend to see far less kicking in the women’s game, and as a result, Kick to Pass ratios in the 1:7+ range are commonplace. Ireland is a notable exception in this instance, but more on that in another article.
Long story short, what is valued at a meta level is different in both codes.
In men’s rugby, territory comes before possession in almost every instance. In women’s rugby, it’s often the inverse. Of course, there are always exceptions to this, but I’ve found that to be a good jumping-off point.
One thing that is the same, however, is the value of 22 entries, and being efficient when you get there, which you can easily track through my Net Efficiency metric. At a base level, it shows you how often your system generates 22 entries, and then how efficient you are at scoring once you get there. The best teams generate lots of entries and score efficiently on those entries, while denying their opponents the same flow of entries and points. This is true in both codes.
So, with that in mind, where are the Irish Women’s team heading into this World Cup?
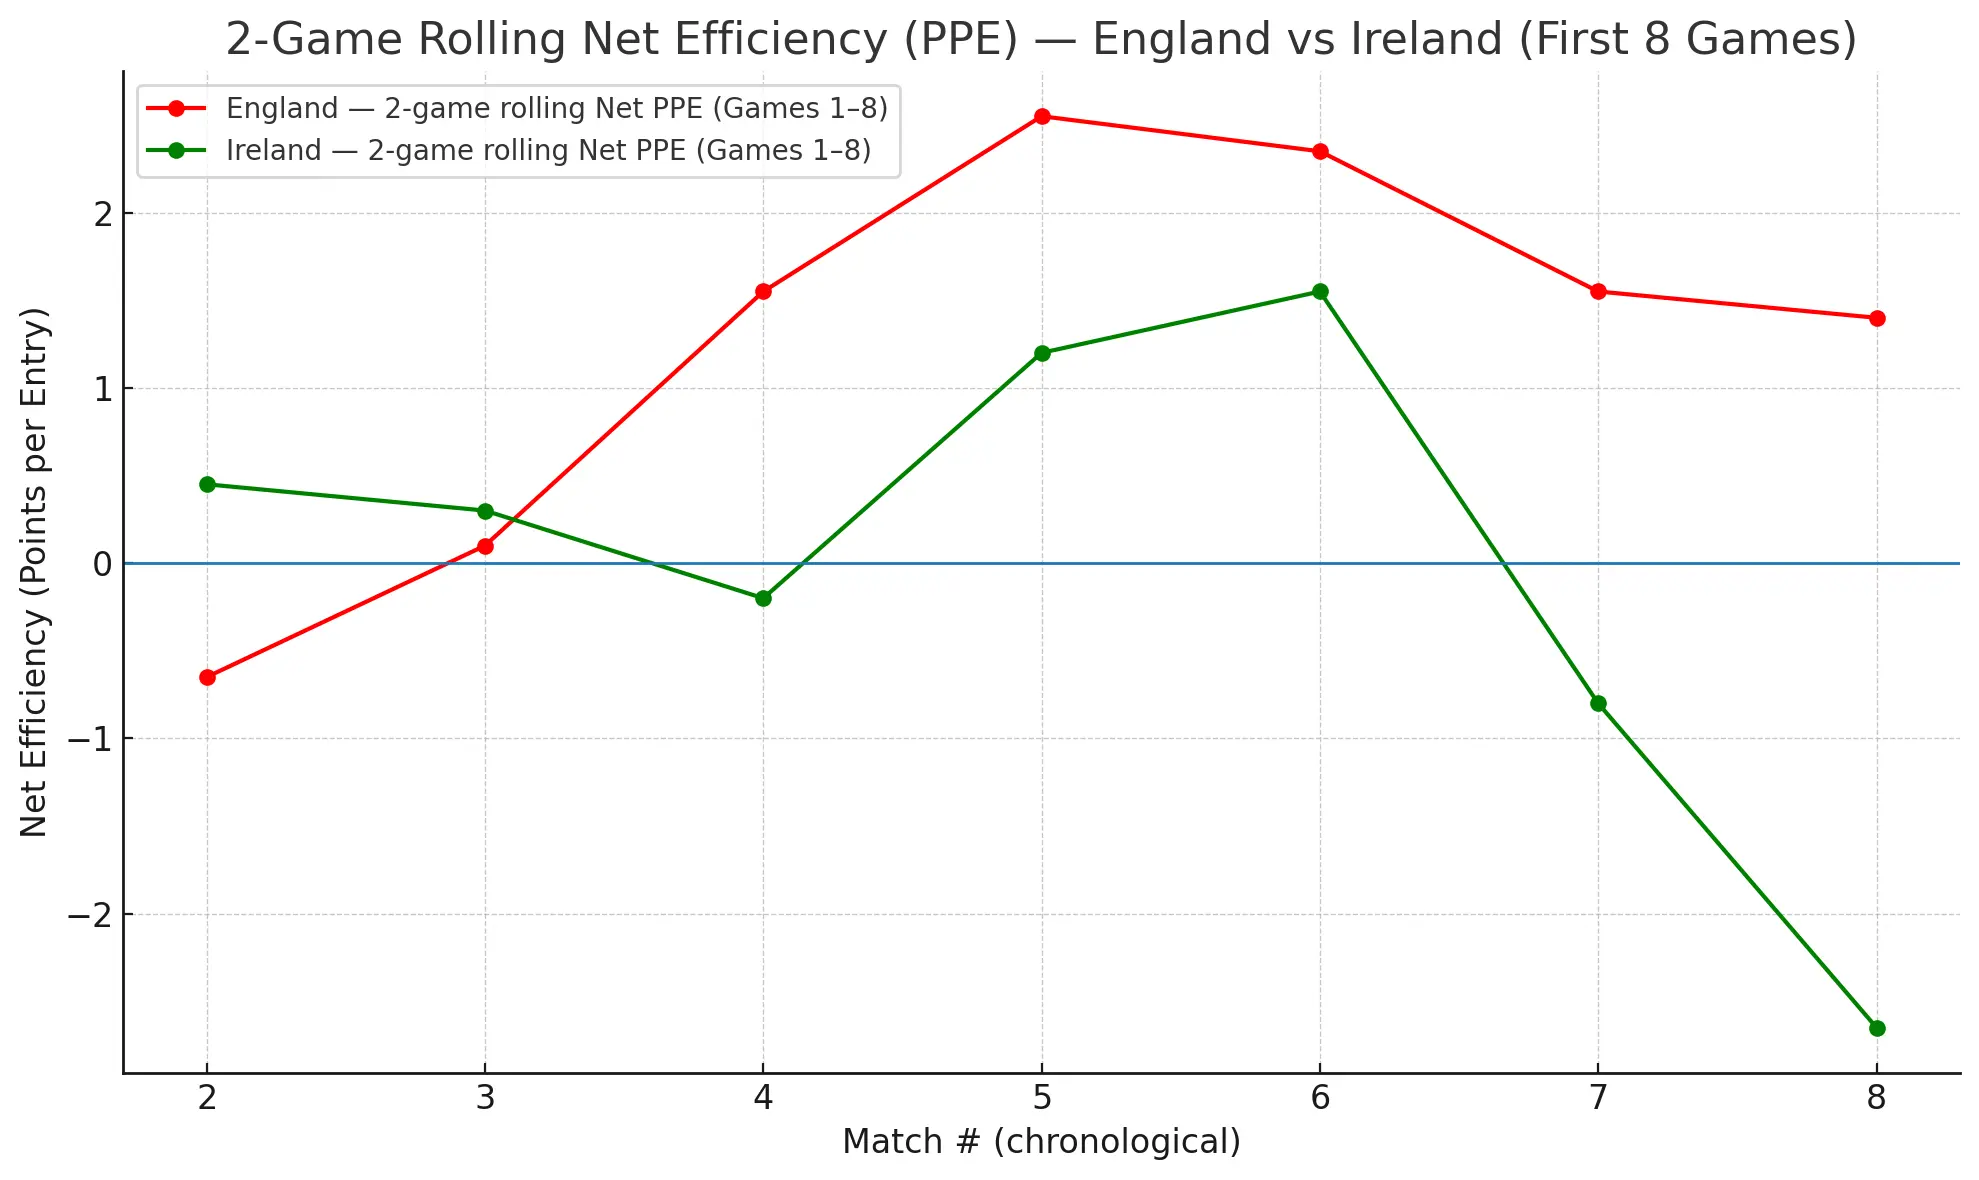
I decided to do a Net Efficiency run of our entire year from WXV1 to the Six Nations, and excluded recent friendlies due to the experimentation involved for both sides.
But this wasn’t enough to get a full picture because, after all, we have no frame of reference for Ireland’s numbers, so I decided to run them against the biggest, most formidable side in the women’s game right now — the Red Roses. England are the best side in the world right now, and they are, for me anyway, absolutely red-hot favourites for this World Cup. Who better to judge your rolling Net Efficiency scoring on than them?
As ever, Net Efficiency is defined as;
Ireland — 2-Game Blocks
| Block | Opponents | Avg PPE For | Avg PPE Ag | Net PPE | Entries For | Entries Ag | Diff | Net 22 pts (total) | per game |
|---|---|---|---|---|---|---|---|---|---|
| G1–2 | NZ & Canada | 2.35 | 1.90 | +0.45 | 15 | 22 | −7 | −5.3 | −2.7 |
| G3–4 | USA & France | 2.10 | 2.30 | −0.20 | 19 | 18 | +1 | +3.4 | +1.7 |
| G5–6 | Italy & England | 3.30 | 1.75 | +1.55 | 14 | 31 | −17 | −1.5 | −0.8 |
| G7–8 | Wales & Scotland | 2.00 | 4.65 | −2.65 | 28 | 9 | +19 | +17.8 | +8.9 |
Block 1 — G1–2 (NZ, Canada)
- Quality (Net PPE): +0.45
- Attack PPE 2.35 (3.6 → 1.1), Defence PPE 1.90 (steady)
- Control (Entries diff): −7 (15 for, 22 against)
- Net 22 pts: −5.3 total (−2.7/game)
Read: Defence gives you a solid floor, but the Canada finishing crash (1.1 PPE) drags the attacking average and, combined with a sizeable entries deficit, flips the points ledger negative. We were quality-positive but territory/pressure-negative.
Block 2 — G3–4 (USA, France)
- Quality (Net PPE): −0.20
- Attack PPE 2.10, Defence PPE 2.30
- Control (Entries diff): +1 (19 for, 18 against)
- Net 22 pts: +3.4 total (+1.7/game)
Read: Near-par quality with a slight entries edge still returns positive points thanks to the USA game cushioning France. This is a balanced/volatile window: small swings in finishing or discipline decide it.
Block 3 — G5–6 (Italy, England)
- Quality (Net PPE): +1.55 (best block)
- Attack PPE 3.30, Defence PPE 1.75
- Control (Entries diff): −17 (14 for, 31 against)
- Net 22 pts: −1.5 total (−0.8/game)
Read: The headline says elite quality, but the reality is control collapses versus England (21 opp entries). PPE excellence can’t rescue that scale of pressure deficit. It’s quality without control.
Block 4 — G7–8 (Wales, Scotland)
- Quality (Net PPE): −2.65 (worst block)
- Attack PPE 2.00, Defence PPE 4.65
- Control (Entries diff): +19 (28 for, 9 against)
- Net 22 pts: +17.8 total (+8.9/game)
Read: Control without quality. We dominated access (+19 entries) but conceded extreme yield on tiny volume (Scotland 6.5 PPE on 4 entries). That single spike detonates the quality of a block, while sheer volume still wins the ledger.
Cross-Block patterns (what really matters)
- Our ceiling is fine; our floor isn’t. One low-volume, high-yield concession (France/Scotland profiles) can undo a whole block. Priority: Def ≤2.0 PPE across blocks.
- PPE alone won’t save us if control collapses (Block 3). Set a hard entries-diff guardrail: no worse than −6 over any two-game block.
- Outliers distort adjacent analysis. Treat blowouts (Italy) as a bonus; design plans that keep the block floor around −0.2 Net PPE even when the outlier rolls off.
Block KPIs to track for the World Cup
- Block Net PPE: target ≥ +0.5.
- Block Opp PPE: cap ≤ 2.0.
- Block Att PPE: sustain ≥ 2.5 (no single-game spikes doing all the work).
- Block Entries Diff: keep ≥ −6 (ideally ≥ 0).
- 22-penalties conceded: ≤ 3 per game (proxy for yield suppression).
- Goal-line stops/turnovers: ≥ 2 per game in tough blocks (France/Scotland profile).
***