


Munster’s new preseason is just around the corner and, with it, a whole slate of different jobs for Clayton McMillan to address, but by far the most important one is a very basic one; addressing core inefficiencies between Munster’s attacking work in the opposition 22 and, crucially, our defensive performance in our own 22.
In the previous article in this series, I went into our defensive numbers in detail, but I felt that on their own, they don’t show the whole picture so over the last week or so, I collated all of Munster’s 22 entries in attack and defence and average points conceded and created a rolling average across all 25 games this season.
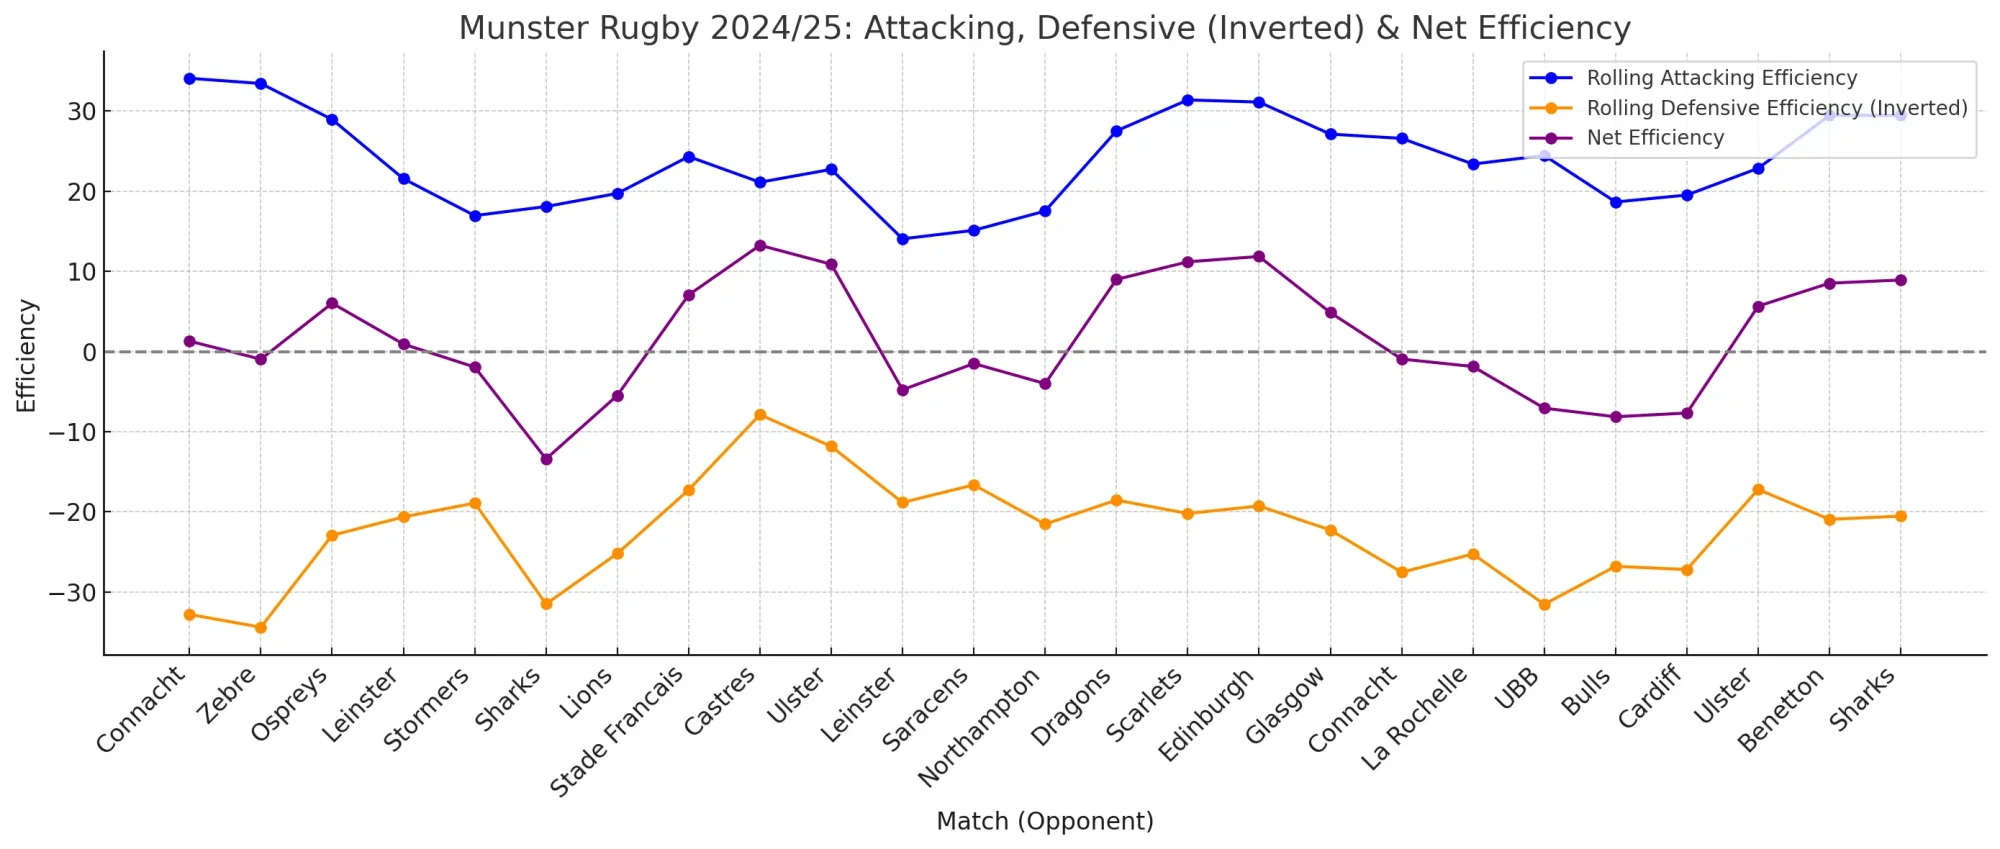
Attacking Efficiency (Blue Line)
This line represents the rolling average of points scored per game from entries into the opposition’s 22, smoothed over 3 games. It reflects how clinical Munster were in turning pressure into points. Higher values indicate strong execution and decision-making in the red zone
Defensive Efficiency (Orange Line, Inverted)
Defensive efficiency is shown as an inverted value, meaning that the more points Munster conceded inside their own 22, the further the line drops. This visual inversion helps illustrate defensive lapses as downward trends, aligning with intuitive visual cues (worse = lower).
Net Efficiency (Purple Line)
Net Efficiency is calculated by subtracting defensive efficiency from attacking efficiency. It provides a quick reference to see whether Munster were “in credit” or “in debt” over a three-game window. Essentially, this is whether they were outscoring their opponents in the 22 or being outscored.
Interpreting the Graph
-
Positive Net Efficiency (above the zero line) indicates games or runs where Munster were dominant in the 22.
-
Negative Net Efficiency reveals stretches where defensive issues, poor conversion, or both, led to struggles and losses (but not always).
-
Converging lines or sharp swings signal tactical changes, form dips, injuries, schedule difficulty or issues in the coaching box.
Key Takeaways
-
The sharp drop before the Sharks fixture on the South African tour coincides with Munster’s worst defensive performance of the season and, ultimately, Rowntree’s departure.
-
Post-Rowntree, there is a noticeable bounce in both attacking and defensive efficiency, suggesting a quick response to the altered coaching direction.
-
Interestingly, our best “loss” from an efficiency standpoint came against Castres, where we scored efficiently and defended well but still lost, due to discipline issues and coughing up a last-minute kick to the corner to win it.
-
Conversely, the worst loss came against the Sharks, where a collapse in defensive efficiency overwhelmed a decent attacking return.

Breaking It Down
Block 1: Rowntree Era (Games 1–6)
Opponents: Connacht, Zebre, Ospreys, Leinster, Stormers, Sharks
- Attacking Efficiency: Starts high but declines steadily, with the team struggling to turn entries into points.
- Defensive Efficiency: Worsens significantly, culminating in a collapse vs the Sharks but was equally poor in the first two games of the season.
- Net Efficiency: Moves deeply negative by Game 6.
- Summary: The team is visibly regressing. Rowntree and Munster part ways after Game 6, and the data supports the decision.
Block 2: Post-Rowntree Recovery (Games 7–9)
Opponents: Lions, Stade Français, Castres
- Attacking Efficiency: Immediate bounce-back, with Stade showing clinical finishing.
- Defensive Efficiency: Tightens dramatically, conceding just 1 point per entry in two of these games.
- Net Efficiency: Turns sharply positive, particularly strong vs Castres (despite the loss).
- Summary: A “new coach bounce” phase. Improved structure and energy, particularly defensively, albeit with a slightly easier schedule.
Block 3: Mid-Season Inconsistency (Games 10–17)
Opponents: Ulster, Leinster, Saracens, Northampton, Dragons, Scarlets, Edinburgh, Glasgow
- Attacking Efficiency: Stays solid, consistently above 20 points from 22 entries if we take the rolling average into account.
- Defensive Efficiency: Inconsistent; fluctuating wildly from tight control to severe lapses in line with our overall poor return defending in our own 22.
- Net Efficiency: Bounces around week to week; a few wins, a few poor performances, a few narrow wins that looked like losses on the data sheet.
- Summary: Unstable form. Capable of real quality (Saracens), but vulnerable to swings in output, linked to issues with depth, most closely seen at home to Edinburgh and Leinster.
Block 4: Late-Season Surge (Games 18–25)
Opponents: Connacht, La Rochelle, UBB, Bulls, Cardiff, Ulster, Benetton, Sharks
- Attacking Efficiency: Reaches sustained levels of quality, even when entry numbers dip.
- Defensive Efficiency: Mixed. Very strong vs La Rochelle and Ulster, weak vs Benetton and UBB.
- Net Efficiency: Mostly positive, peaking vs Scarlets and Ulster.
- Summary: A strong finish post Six Nations. Tactical cohesion reappears, particularly in high-level contests.
Key Takeaways Across Blocks
- Block 1 (Pre-Rowntree Departure): Defensive and attacking inefficiencies combine; worst phase of the season or any season under Rowntree.
- Block 2 (Post-Rowntree bounce): Clear coaching impact with instant improvement.
- Block 3 (Mid-season): Inconsistent; big games won and lost without a clear pattern.
- Block 4 (Late surge): Improved net efficiency and more stable form post Six Nations.
But what do all these data points mean? For proper clarity, we need to establish a baseline for efficiency on both sides of the ball, and the only side we can compare against playing broadly the same opponents is… Leinster. I know, I know, but I promise, it’s enlightening.
I crunched Leinster’s numbers for their URC title-winning season. Here’s their rolling efficiency for 2024/25 and… man, it’s really good.
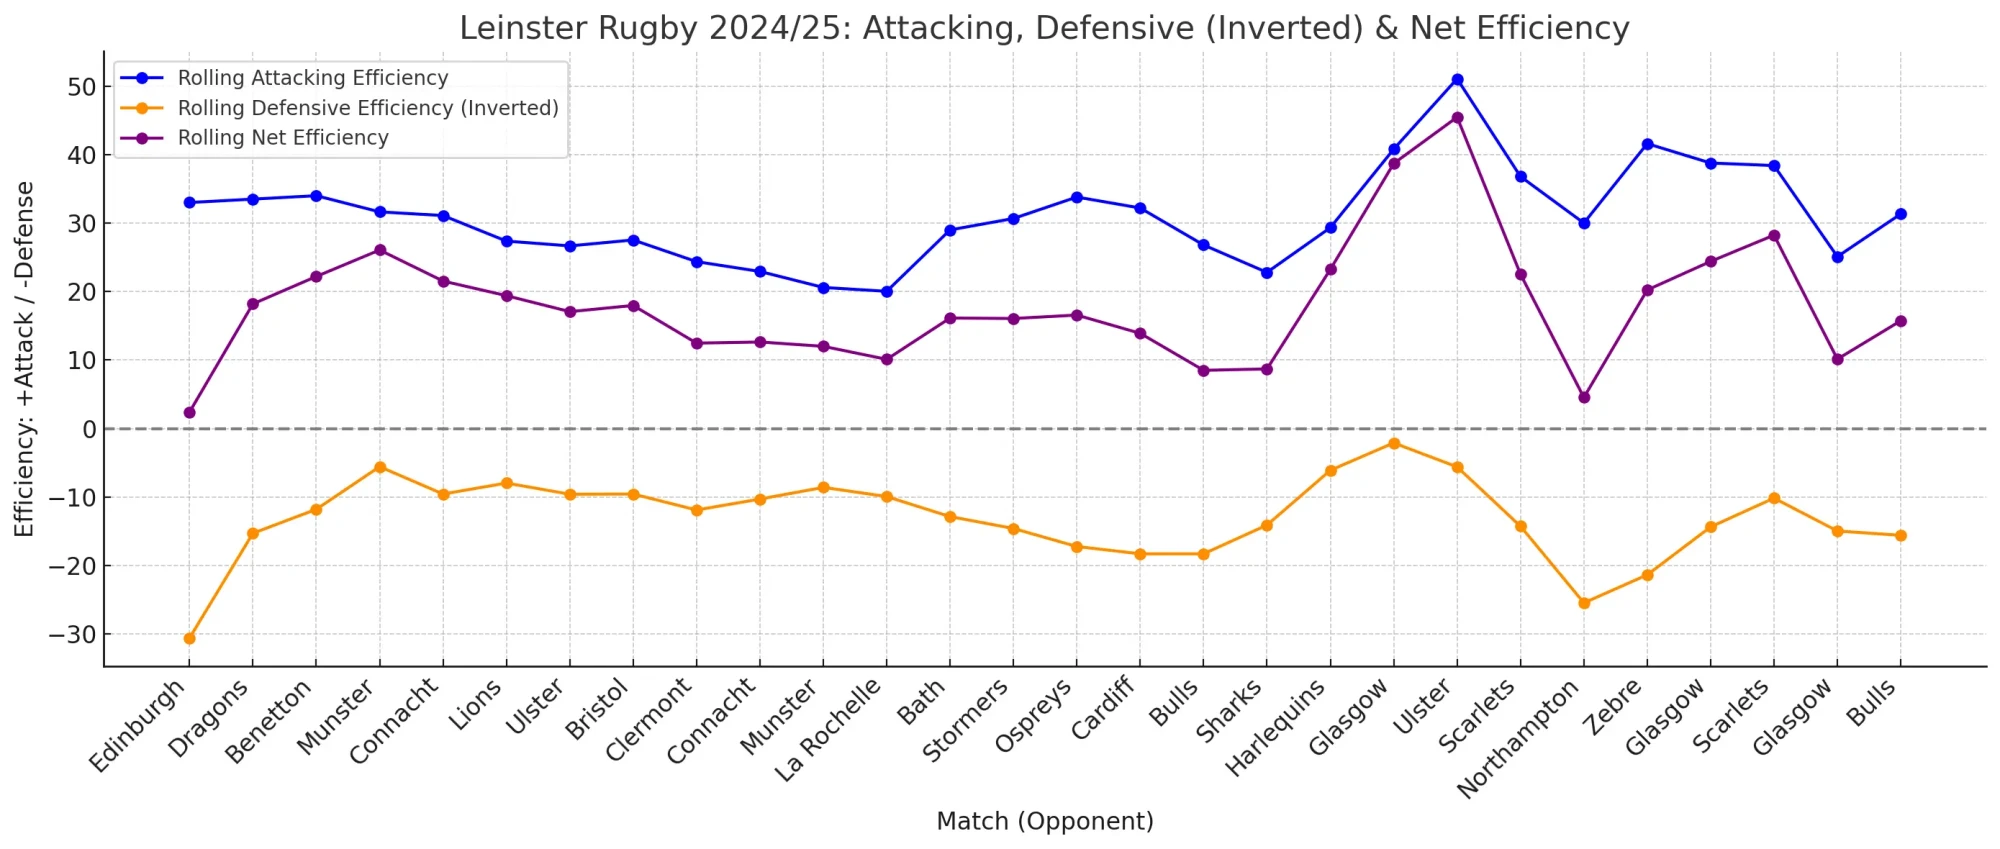
Immediately, you see the difference.
The key points;
-
Leinster showcase a highly consistent and dominant attacking performance. This shouldn’t be confused with attacking expansivity either; it’s literally about gaining entries to the 22 and then converting them into points.
-
They have generally very low defensive concession rates, with a few spikes (notably vs Scarlets and Northampton)
-
They have a sustained positive net efficiency – the mark of a title-contending side
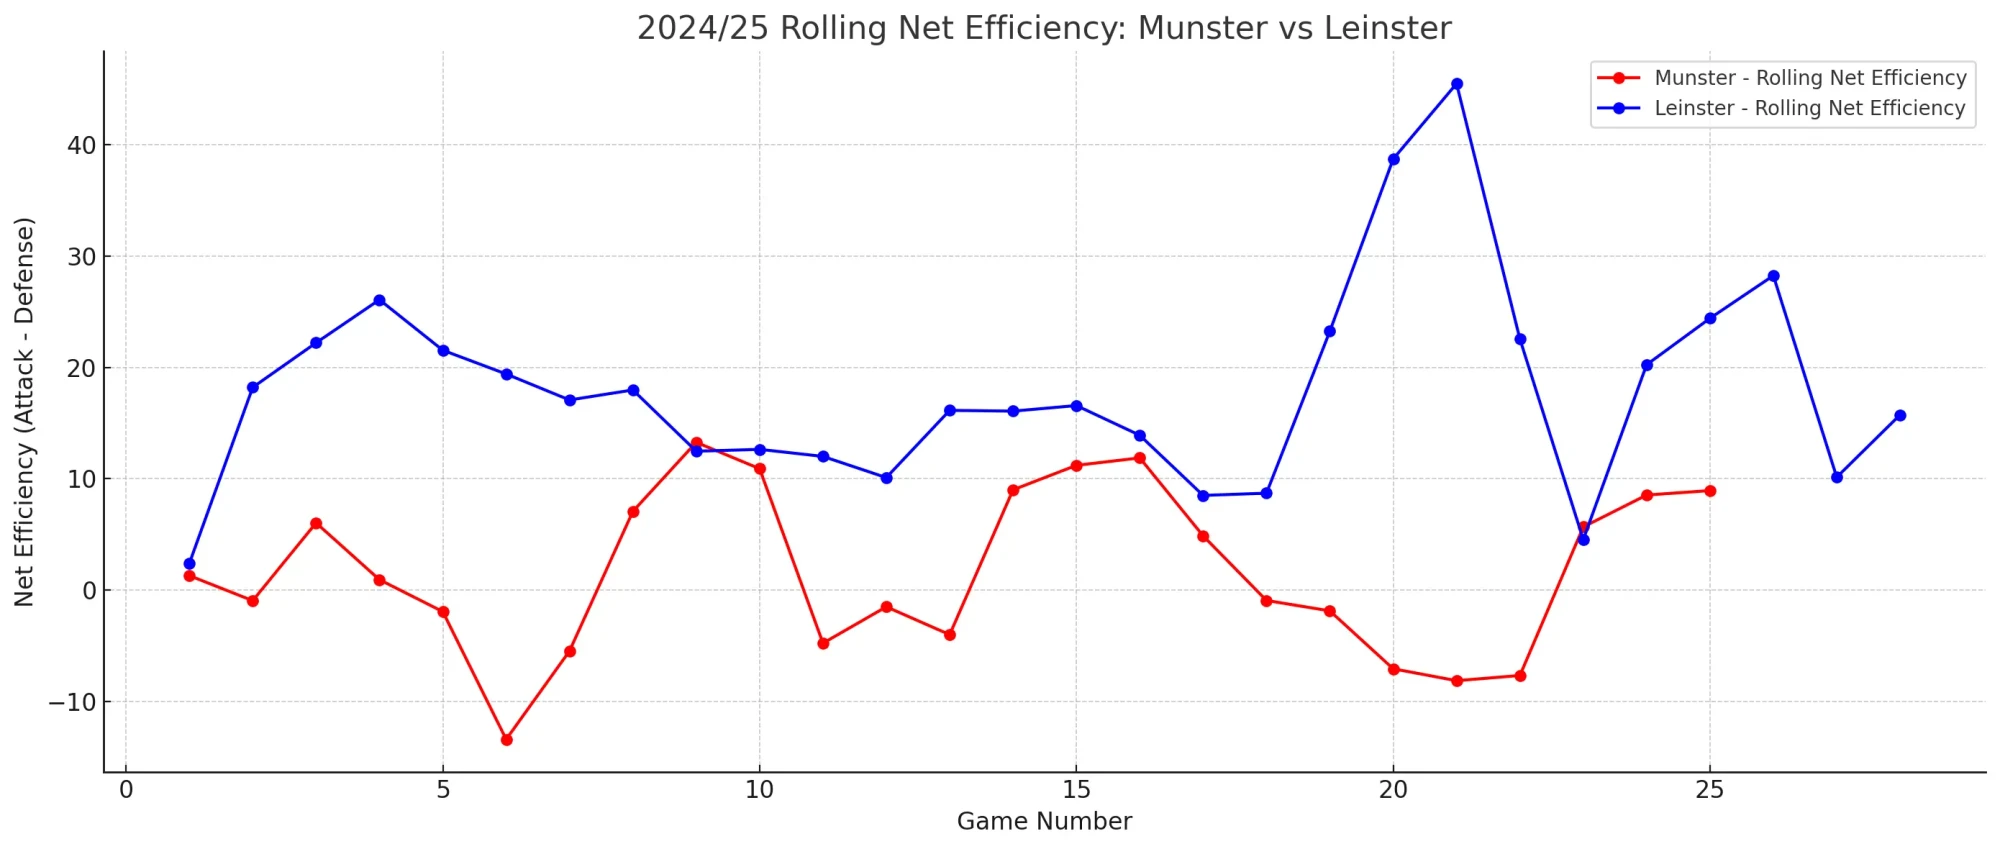
When we graph that net efficiency next to Munster’s for the season, we can see the difference in performance across the season.
Munster vs Leinster: 2024/25 Efficiency Comparison
Overall Performance Profile
| Metric | Munster | Leinster |
|---|---|---|
| Total Games Tracked | 25 | 28 |
| Win/Loss Record | 13W / 10L / 1D (1 unlisted) | 25W / 3L |
| Rolling Net Efficiency | Highly volatile, peaks and troughs | Consistently positive, only minor dips |
| Coaching Disruption | Yes – Rowntree gone after Game 6 | No – Stable staff and systems |
| Best Net Efficiency Phase | Games 7–9 (Post-Rowntree bounce) | Games 1–10 and 18–21 |
| Worst Net Efficiency Phase | Games 4–6 (Rowntree end: Stormers & Sharks) | Games 21–23 (Scarlets & Northampton losses) |
Attacking Efficiency
| Dimension | Munster | Leinster |
|---|---|---|
| High Points | Scarlets, Edinburgh, Benetton (4+ points per entry) | Zebre (5.4), Benetton (7), Harlequins (3.4) |
| Low Points | Bulls (1.2), Leinster 1 (1.7), Stormers (1.9) | Clermont, La Rochelle, Connacht 2 (1.3–1.5) |
| Attacking Style Trend | Inconsistent finishing, even with high entries | Sustained and structured; clinical inside 22 |
| Notable Pattern | Many games with 10+ entries but <2 points/entry | Several games with <10 entries but 20+ points scored |
Defensive Efficiency (Inverted)
| Dimension | Munster | Leinster |
|---|---|---|
| Strongest Performances | Saracens, Stade, Lions (1 or less per entry) | Dragons, Sharks, Harlequins, Glasgow (0–1) |
| Weakest Performances | Zebre (6), Sharks (5.4), Scarlets (4) | Scarlets (7), Northampton (4.8) |
| Structural Issues | Leakiness under pressure, even with low entry count | Isolated lapses, rarely sustained |
| Key Concern | Gave up >4 points per entry 6 times | Only 2 major spikes across the entire season |
Net Efficiency and Trends
| Pattern | Munster | Leinster |
|---|---|---|
| Volatility | Extremely volatile – multiple -10+ and +10+ swings | Remarkably stable, mostly +10 to +25 range |
| Post-crisis Recovery | Immediate bounce post-Rowntree (Games 7–9) | Only minor form dips, quickly corrected |
| Late Season Form | Steady improvement from Game 18 onwards | Strong end with explosive attack, minor defensive slips |
| Losses with Positive Net | Castres (strong attack/defence, still lost) | Scarlets (high attack, bizarre defensive collapse) |
Summary Insights
Munster
- Season defined by inconsistency and mid-season turbulence.
- Capable of high-ceiling performances (Saracens, Scarlets) but undermined by poor defensive metrics early on.
- Rowntree’s sacking was data-backed: net efficiency dipped into crisis levels by Game 6.
- Finished with encouraging signs of balance and more tactical clarity under new leadership.
Leinster
- Defined by structural consistency and ruthless execution.
- Only dropped net efficiency significantly in two matches all season.
- No coaching disruptions, and squad depth carried them through congested periods.
- Losses were either marginal or freak defensive lapses — never systemic.
Conclusion
- Leinster were the benchmark of efficiency, with reliable systems in both attack and defence.
- Munster had a chaotic but redeemable season: a narrative of two halves, with post-Rowntree improvements pointing to a potentially upward trajectory under new leadership.
In a grand sense, Munster’s season was defined by inconsistency and inefficiency, braced by games where everything seemed to click with the talent we have in the squad, leading to big wins and high scores. That was especially true towards the end of the season, post-Six Nations, when core talent returned from the Six Nations and injuries began to clear up consistently.
But even with this, there are obvious areas for Munster to improve on both sides of the ball and no better time to start than next week.