


Nothing ever just happens.
There’s always a reason for something being one way or the other, and if that reason isn’t immediately obvious, you need to look deeper. For example, your Sky remote didn’t just fall off the couch for the thousandth time, breaking it and requiring a replacement; it’s designed to be unstable on a flat surface, most likely an armrest or cushion, so any bump at all sends it tumbling to the floor.
It didn’t just ray-hee-ayn on your wedding day, a million small movements of air pressure swirling thousands of kilometres away sucked warm water vapour up, blew it towards Ireland and then you decided to get married in Limerick in January.
So when I was writing the latest Anatomy of a Season article last week and, while researching it, realised this season was a historically bad one from a defensive perspective in league play, I had to find out what the problem was because this seemed like a complete aberration.
First of all, the context.
Munster’s 2024/25 ranks as the second-worst league season out of our 24 seasons on record for points conceded, and 24th out of 24 when it comes to tries conceded.
This seems pretty bad, on the face of it, but we have to apply logic to it; tries are being scored in the modern game at a rate above that of previous eras.
In the context of the URC, the median number of tries conceded was 60; we conceded 59, which gives us a relative score of -1 compared to the rest of the league.
The top four sides in the URC this season had a relative concession score of;
- Leinster (-25)
- Bulls (-16)
- Sharks (-1)
- Glasgow (-20)
Last season, the median number of tries conceded in the URC was 55, five fewer than this season, which we’d expect given the general trends in the game across the season.
- Munster (-17)
- Bulls (-1)
- Leinster (-12)
- Glasgow (-20)
We’re seventeen points under the median number of tries conceded. The previous season, we finished fifteen points below the median number of tries conceded.
In that context, jumping right up to the median was incredibly costly, so whatever about historic performances, this season was an aberration in our recent history under defence coach Denis Leamy.
So what went wrong?

After a bit of digging, I found one area that might explain this aberrant defensive performance across the season, in both European and URC rugby.
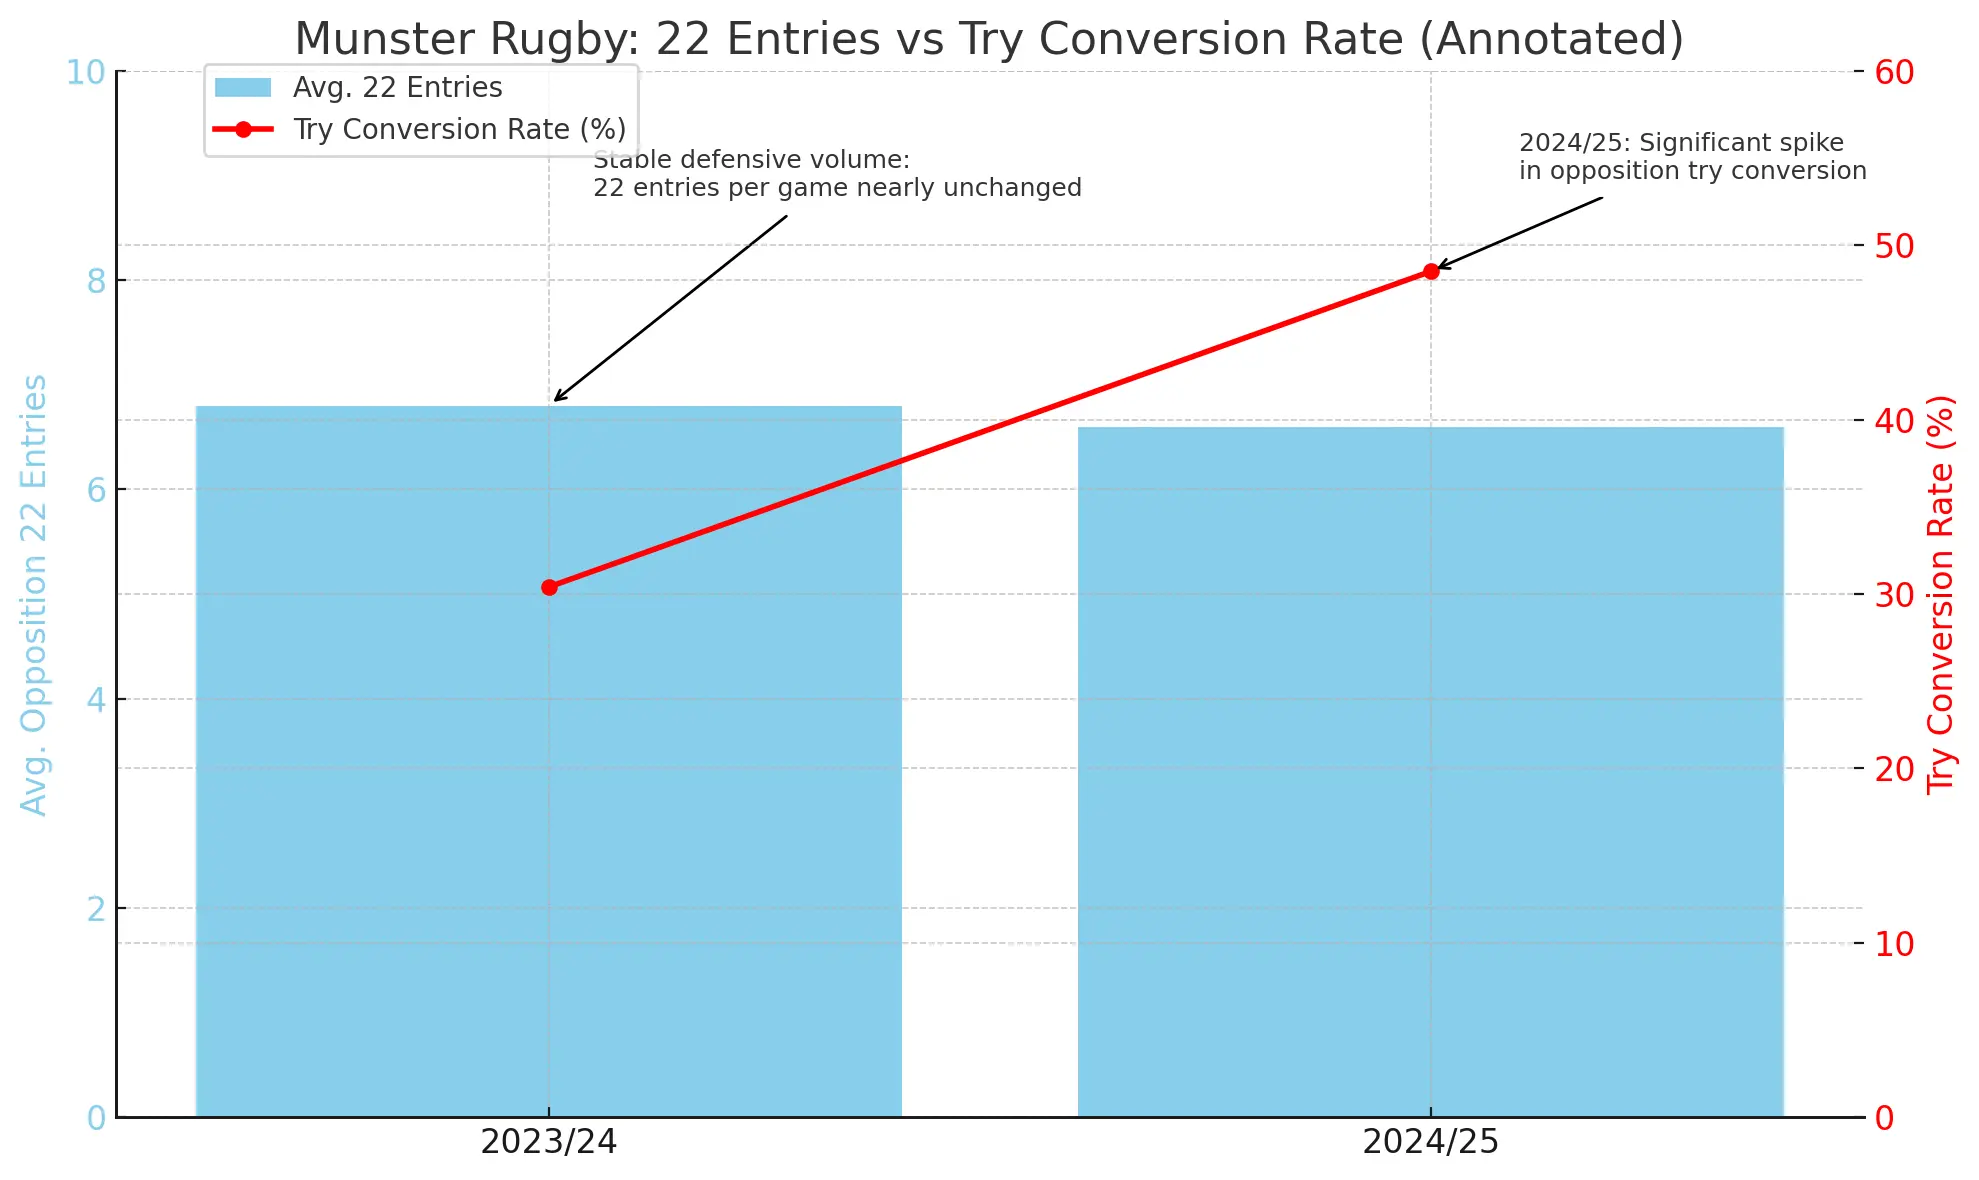
In 2023/24, we conceded the lowest average number of 22 entries per game in Europe, at just 6.8 entries per game. We also ranked fifth in defensive efficiency on those entries; we conceded 30.4% of the time once the opposition got into our 22, which didn’t happen often.
Our scoring efficiency last season was middle of the road; an average of 8.9 entries per game and 38.2% scoring efficiency would have us ranked around teams like the Ospreys, Cardiff and Exeter. So we weren’t creating an elite number of entries or converting the ones we did create at an elite level.

This season, we have the lowest average number of 22 entries in the entire world across the URC, Super Rugby, Gallagher Premiership and the TOP14, with, again, just 6.8 entries conceded per game. But here’s the kicker: our defensive efficiency on those entries has plummeted. We concede on 48% of opposition entries to the 22, which is ranked bottom four in the world this season, with only Moana Pasifika (7th in Super Rugby but with the most tries conceded in the league), Newcastle Falcons (rock bottom of the Gallagher Premiership with 101 tries conceded this season) and the Dragons (bottom of the URC and with 20 more tries conceded than the next lowest team) ahead of us on this ranking.
This is a jump of 18% in tries conceded on 22 entries year on year in basic numbers, which is a remarkable statistic, but it’s actually a 60% relative increase on the previous season.
It’s a stark visual.
On the offensive side of the ball, we had slightly fewer entries on average – 8.8 average offensive entries – and a modest increase to 42.1% scoring efficiency, which is enough to get us into the top 20 worldwide. So, nothing outlandish that would suggest defensive efficiency was sacrificed for a big shift in offensive output.
So what happened?
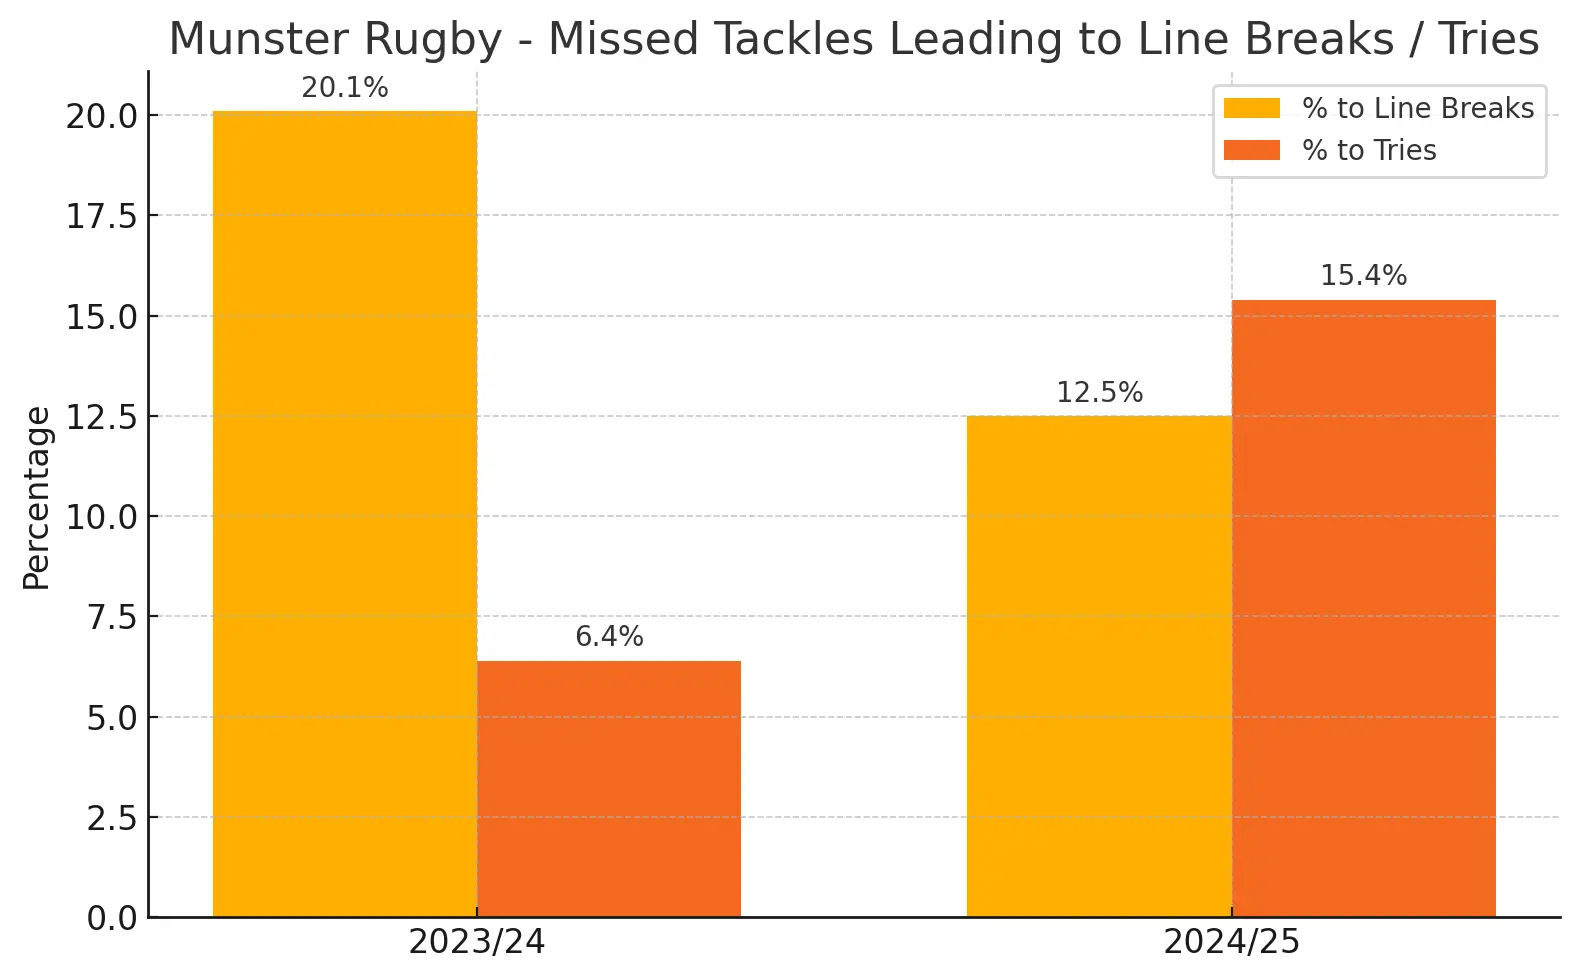
When we drill down into the defensive metrics, a few more things jump out on our tackle stats across the season. Missed tackle percentages don’t interest me all that much, but what our missed tackles lead to is instructive.
Here is our year-on-year change when it comes to the missed tackles that lead to linebreaks and the missed tackles that lead directly to tries;
When we combine this 22-entry data with our tackle data, there appears to be something of a correlation. It’s always a bit risky to look for correlations, but I think the data here suggests a possible trend that we can identify.
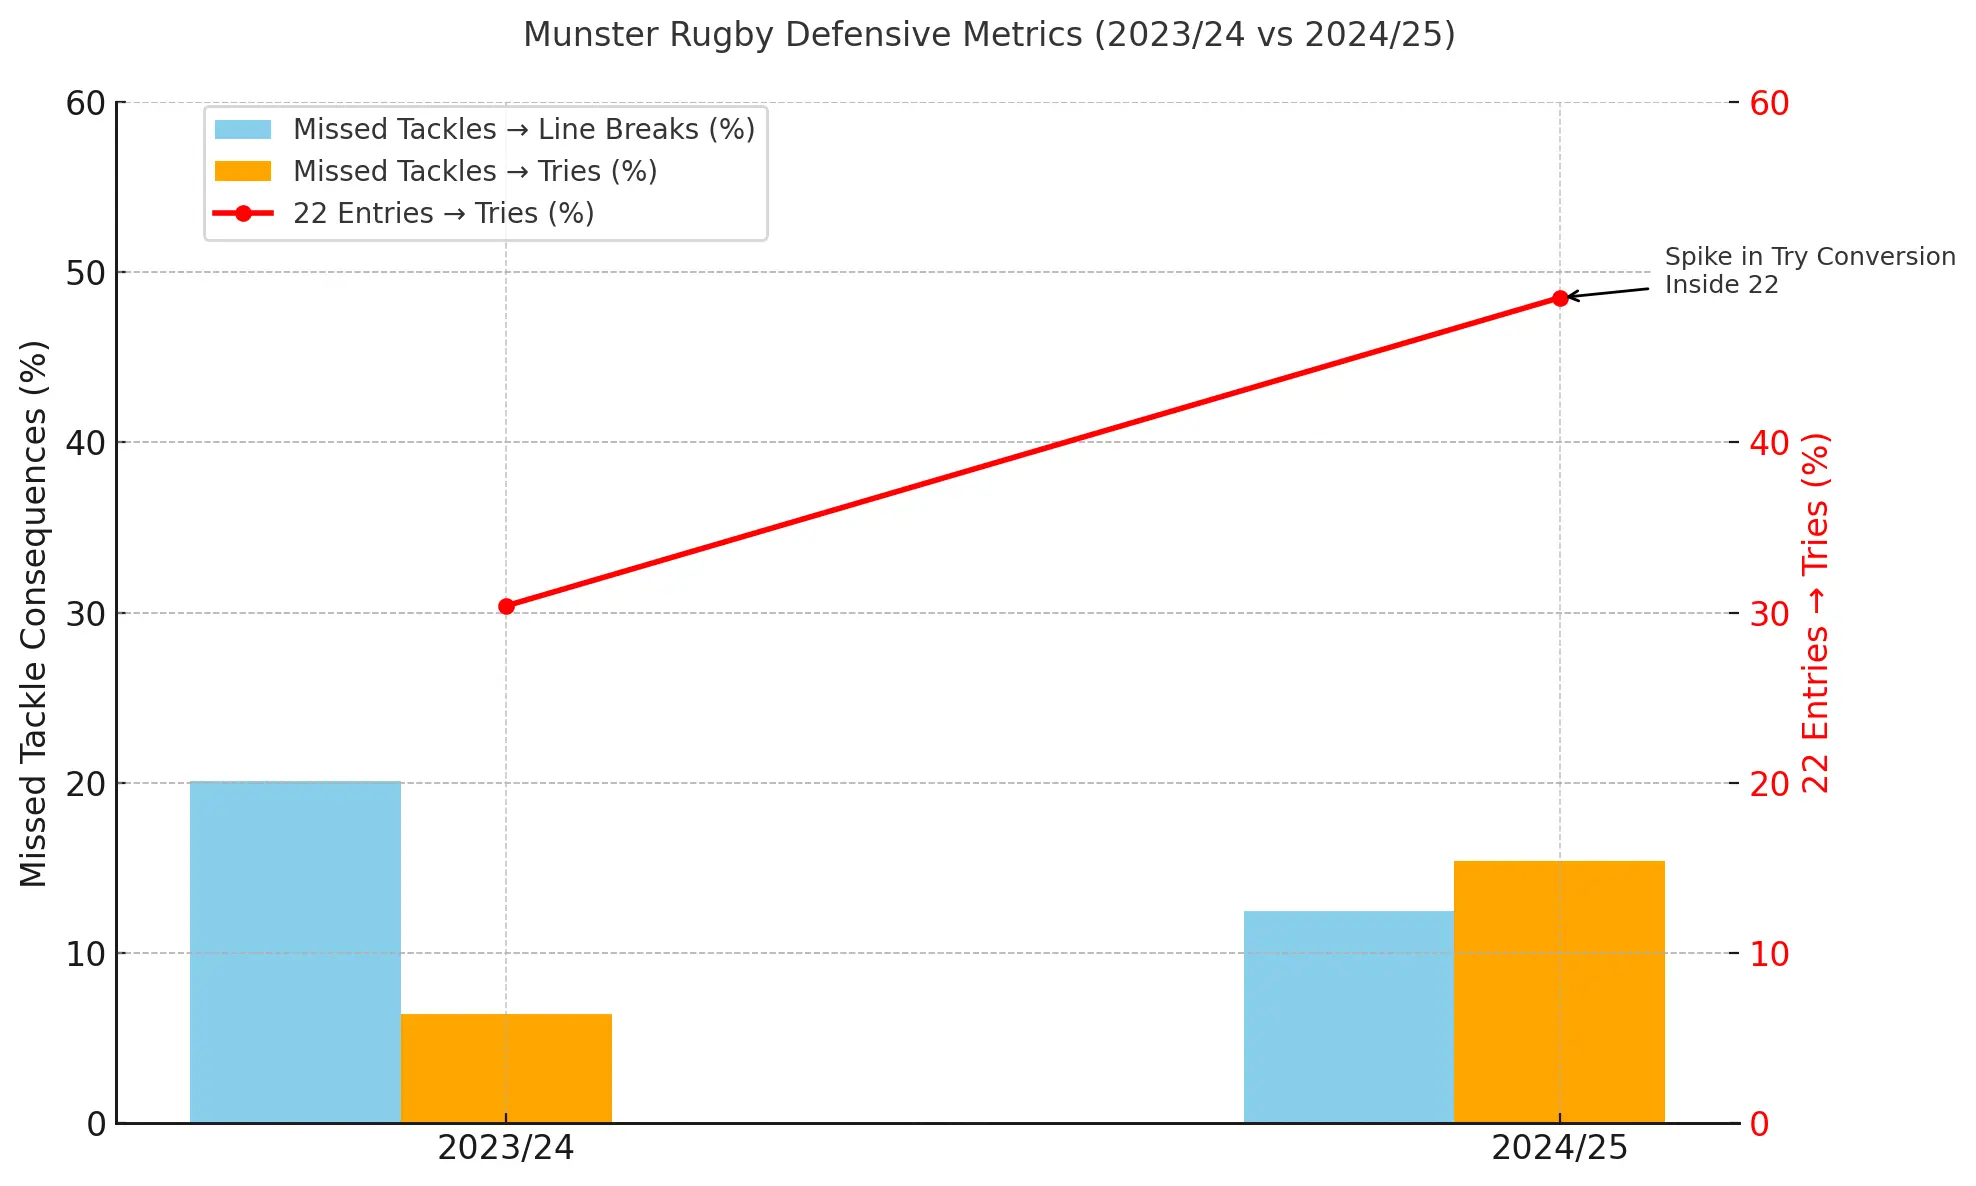
We aren’t facing an increased volume of defensive threats, and keep in mind that this is in an environment where more tries are being scored in general, but once the opposition gets into our 22, they are converting at a rate broadly in line with our increase in missed tackles that lead to tries.
What does this suggest?
That our red zone defence has collapsed in a way that isn’t easy to quantify. We’re denying opponents entry at the same volume as last season, which is reflected in better metrics in denying missed tackle linebreaks. At the same time, I think we can take from the data that the 140% relative increase in missed tackles leading to tries is a sign that our defensive structure is more brittle than in previous seasons under Leamy.
When you also consider that we kicked more this season in the URC than last season, we can start to piece together our sequencing. Last season, we were 11th in the URC for kick volume; this season, we ended up in sixth – a pretty big change – while also being #1 in the competition for retaining kicks.
What does this tell us about our defence? To me, it says four things primarily.
1. Territorial Strategy: More Kicks, Same Distance = More Time in Middle Third
-
With distance unchanged, the extra kicks aren’t massive James Lowe-esque territory grabbers or big 50:22 gambles – they were, instead, contestable kicks aimed at the midfield or backfield.
-
Suggests a pressure game plan: forcing errors, slowing tempo, and playing without the ball in the middle third at a higher volume than usual.
2. Possession Trade-Off
-
More kicking typically means less possession overall.
-
If the kick-chase and defensive structure are strong, this can be a great starter sequence for most teams, and our increased tackle count season-on-season suggests that we played a more off-ball style, especially in the latter half of the season.
-
But if defensive errors are more costly (as we’ve seen with try conversion %), this strategy becomes high risk:
-
You concede fewer 22 entries overall…
-
But when the entries come, you’re conceding tries at a higher rate.
-
3. Fatigue & Phase Count
-
Kicking more can reduce total phase load – good for energy conservation over a long season, especially for tight five players and edge defenders, an area where we’ve had a lot of injuries and, in the tight five in particular, have had to rely on ageing veterans.
-
However, it increases transition exposure, where defensive misreads or poor chase setups can lead to dangerous counterattacks, especially post-escort law tweak in January. Our kicking volume shooting up in the second half of the season seems like a reaction to this.
4. Attacking Identity Shift
-
Fewer ruck/set-piece starters = fewer structured attacks.
-
Indicates we may be de-prioritising multi-phase attack in favour of capitalising on opponent mistakes, turnovers, or broken-field play.
So, essentially, more kicking = more open-field moments and transitions. Missed tackles in space become more punishing as a result, as does the degradation of our scrummaging performance post-Rowntree and with the injuries to Jager, in particular.
The rise in tries per missed tackle and opposition 22-entry conversion aligns with this; the trends suggest that we’re being caught in retreat or transition more often, or else conceding penalties in dangerous areas in an attempt to “stem the bleeding” after we concede a linebreak.
This suggests that elements of shifting law interpretations and our reaction to them have led to more exposure on the defensive side of the ball. So is it systemic or individualistic?