

I’ve had the feeling so far this Six Nations – and, indeed, this season over all – that Ireland have not been playing well. We’ve only lost once this season and just twice since the World Cup in 2023, but something seems… off.
So I tried to figure out what I was feeling. Was it saltiness over Sam Prendergast essentially getting parachuted in ahead of Jack Crowley purely on the whim of the coaching staff rather than any great underperformance from the West Cork man? That definitely plays a part in it, and it would be dishonest to pretend that it doesn’t.
But it doesn’t even tell a tenth of the story either.
From a metric’s perspective, this Six Nations performance is down year-on-year when we look at anything except wins and losses. Now, wins and losses are the most important thing – I fully accept that – but I think it’s also appropriate to look at some of the underlying data for the Six Nations performance so far. On a game by game average, there is a noticeable underperformance and, not only that, a radical style change to go with it.
In 2024, Ireland produced the following on a per game basis;
- Tries: 3.8 tries per game (#1 in Six Nations)
- Linebreaks: 7.2 linebreaks per game (#1 in Six Nations)
- 22 Entries: 9.6 entries per game (joint #1 in the Six Nations)
- Passes: 203 passes per game (#1 in the Six Nations)
- Kicks: 28 kicks per game (#3 in the Six Nations)
- Tackles: 132 tackles per game (#4 in the Six Nations)
- Ruck Arrivals: 247 ruck arrivals (#2 in the Six Nations)
In 2025, after three games, we are producing the following;
- Tries: 3.3 tries per game (joint #2 in the Six Nations) Down Year on Year
- Linebreaks: 6 linebreaks per game (#4 in the Six Nations) Down Year on Year
- 22 Entries: 9.3 entries per game (#3 in the Six Nations) Down Year on Year
- Passes: 170 passes per game (#4 in the Six Nations) Down Year on Year
- Kicks: 31 kicks per game (#3 in the Six Nations) Up Year on Year
- Tackles: 161 tackles per game (#2 in the Six Nations) Up Year on Year
- Ruck Arrivals: 197 ruck arrivals per game (#4 in the Six Nations) Down Year on Year
Assessing the drop in attacking ruck arrivals and kicks per game, together with the statistically significant rise in tackles per game, reveals the big stylistic change to me.
Since an attacking grubber kick down the 5m tramline and a box kick receive the same marking, kicks per game are no longer informative. We have to break down how Ireland have been kicking; this is where it gets interesting.
Ireland have the highest average kicking distance in the Six Nations so far and the most amount of kicks classed as “clearances” – these are kicks that travel further than 30m.
When we assess the teams with highest kicks per game on average, the longest distance per kick on average, and the teams with the most clearance and box kicks, a distinct trend establishes itself when we cross reference this data with attacking ruck arrivals.
Italy, England and Ireland kick the longest on average in the Six Nations and top the charts for Clearance and Box kicks. So it stands to reason that they are the teams who are kicking to compete the most. France, however, are just slightly behind Ireland in kicking volume, so what’s the difference?
When we look at Attacking Ruck Arrivals, Ireland, England and Italy make up the bottom three in roughly the same order that the make up the top three in kicking volume and distance.
- Scotland: 291 ruck arrivals per game on average
- Wales: 255 ruck arrivals per game on average
- France: 230 ruck arrivals per game on average
- Ireland: 197 ruck arrivals per game on average
- England: 193 ruck arrivals per game on average
- Italy: 163 ruck arrivals per game on average
So, finally, we come back to efficiency of creating the real currency of attacking rugby – how many passes it takes you on average to earn a linebreak?
Last season, it broke down like this across Six Nations 2024;
- England: 22 passes per linebreak
- France: 27 passes per linebreak
- Ireland: 28 passes per linebreak
- Wales: 39 passes per linebreak
- Scotland: 34 passes per linebreak
- Italy: 30 passes per linebreak
This year, it breaks down as follows;
- France: 16.81 passes per linebreak
- England: 18 passes per linebreak
- Italy: 23 passes per linebreak
- Ireland: 28 passes per linebreak
- Scotland: 31 passes per linebreak
- Wales: 47 passes per linebreak
Ireland have altered their game plan to include more kicking per ball handling action, made a radical change at #10 and altered their style to find more similarities with Steve Borthwick’s England than I think I ever expected… all for the same number of linebreaks per pass. If anything, England are generating more linebreaks per pass while playing broadly the same style.
So with that, I decided I was going to track where Ireland’s attacking focus was for generating linebreaks, but I found that we were generating so few breaks per game that I included half-breaks in the metrics to get an idea of where we were generating opportunities.
As in the next article, I’ll include the data from England, Scotland and France; this week’s article is just the game against Wales. First, let’s determine the source of the linebreaks. To visualise this, I included five general ruck positions to give you a setting for where the linebreaks are happening all at once.
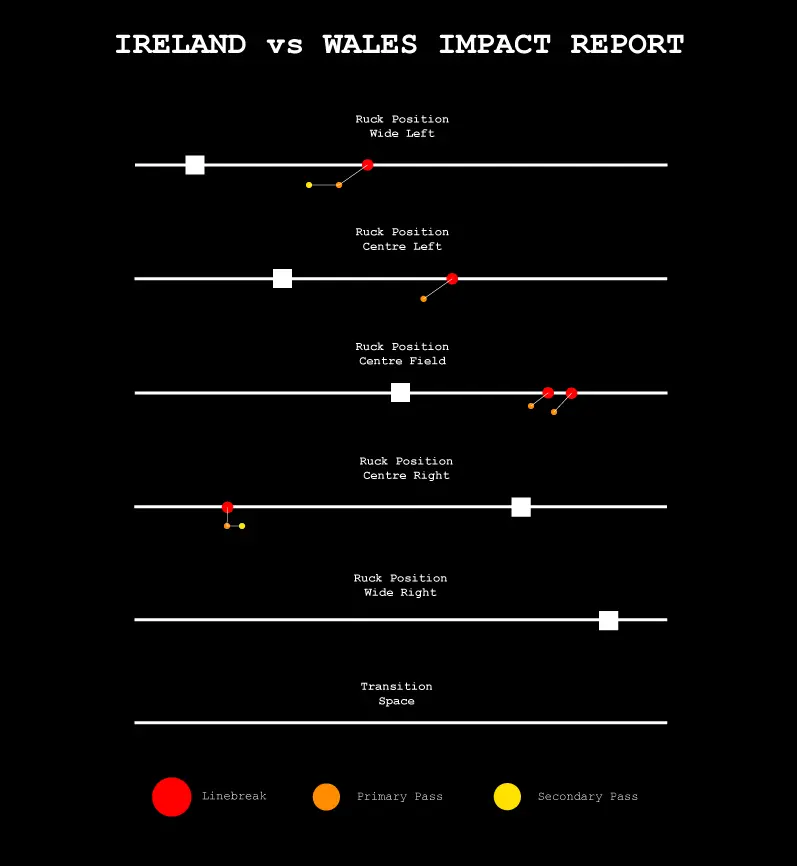 Impact-Template
The most common distance for an Irish linebreak or half-break against Wales came approximately 21m from the ruck where the ball originated, assuming a pitch width of approximately 70m. Ireland had an official ruck count of 86 and took an average of 80 passes to earn two official linebreaks.
Impact Rating
When assessing the value of passes that lead to a linebreak or half a linebreak, we have to look at them in a chain. I look two passes back from the initial scrumhalf pass, unless the scrumhalf pass directly affects the line break or half a linebreak itself. For this data, I counted breaks that would have counted as full linebreaks if not for an excellent tackle or a handling error on behalf of the player who makes the linebreak.
A Secondary Pass in a linebreak chain is valued at one point.
A Primary Pass – or direct linebreak assist – is a pass that is followed by a linebreak and is worth three points.
| Name | Primary Pass | Secondary Pass | Total |
|---|---|---|---|
| Jamison Gibson Park | 1 | 2 | 5 |
| Sam Prendergast | 1 | 2 | 5 |
| Mack Hansen | 1 | 3 | |
| Robbie Henshaw | 2 | 1 | 7 |
| Joe McCarthy | 1 | 1 | |
| Dan Sheehan | 1 | 1 |
The biggest generator of linebreak opportunities against Wales was Robbie Henshaw. Here’s an example of his passing work prior to a Jack Conan half-break, with a secondary pass from Joe McCarthy and Sam Prendergast.
This screened pass action with a narrow forward acting as the punch option is typical of Ireland’s attacking work this year, with the target for the punch being in that sweet spot approximately 20m away from the ruck.
Here’s another example of that concept; Hansen makes his Primary pass to assist Osbourne’s linebreak around 25m from the previous ruck, which is right at the limit of Ireland’s creative range.
Prendergast’s role against Wales – and in the games I’m currently coding with these parameters – is as a secondary passer. He is the guy who feeds the pass to the player’s who will then make the primary pass that feeds the linebreak. This is because his average position is almost always as the first back near the ruck and rarely takes the second or third pass in a passing chain.
Whether this trend holds against the most difficult opponent Ireland will face in this year’s Championship remains to be seen, but it’ll be interesting to see if our increase in kicking, decrease in passing and ruck arrivals translates against a more physical opponent.
What should we expect to see against France? Will a harder, more physical defence provide more space in that 20m space? Or will a smothering outside in defence cut off our passing options altogether?
We’ll see.