


While Munster’s issues in attack were pretty clear last season, the real story of that difficult campaign came on the defensive side of the ball, with a try concession rate on 22 entries down there with one of the worst in the world. That, on its own, doesn’t have to be a season killer, but it essentially means you have to outscore your defensive frailties consistently to do pretty much anything.
And nobody managed that.
Of the winners of the Gallagher PREM, URC, TOP14 and European Champions Cup, only Bath had a try concession rate on 22 entries higher than 30%, which perhaps says a little more about the PREM (and Challenge Cup) than you’d think.
Everyone else who won a trophy — Leinster (29.4%), UBB (27.9%) and Toulouse (25%*) — was below that 30% mark across the full season.
* Best in the club game worldwide
That doesn’t mean they were perfect across every single game of the season — far from it — or that the eight teams who stayed below that 30% threshold all had great seasons, but the trend is pretty clear to see. At a base level, it’s pretty simple; stop tries from going in and convert them at a decent level on the other side, and you’ll do well. On the attacking side of the ball, Bath had the highest try conversion rate (44%), followed by Leinster at 42.6%, with UBB and Toulouse both under 40%. The biggest trend there was actually on entry volume, rather than efficiency, with all four European trophy winners last season earning at least 10.4 entries per game on average, and they all fit in at the top of the chart last year for that metric.
But none of that matters without the defence to back it up, and encouragingly, Munster seem to be trending in the same direction.
Let’s have a look at what Leinster vs Munster in Croke Park showed us here.
Match Snapshot (per 22 entry)
- Munster attack: 8 entries × 3.5 pts/entry = 28.0 expected points
- Leinster attack: 11 entries × 1.2 pts/entry = 13.2 expected points
- Expected margin: +14.8 → Actual +17 (31–14)
- Entry differential: –3 (8 vs 11)
- Net Efficiency (NE): +2.3 pts/entry (3.5 − 1.2)
Component Edges
Attacking Efficiency vs Leinster’s: +2.3 (3.5 vs 1.2)
Volume (entries): disadvantage (–3), overcome by elite per-entry return.
Season-to-date update (2025/26, R1–R4)
| R | Opp | Att E | Pts/A | Def E | Pts C/def | NE | Roll-2 | Roll-3 |
|---|---|---|---|---|---|---|---|---|
| 1 | Scarlets (A) | 11 | 3.0 | 12 | 1.7 | +1.3 | +1.3 | +1.3 |
| 2 | Cardiff (H) | 8 | 2.8 | 8 | 2.5 | +0.3 | +0.8 | +0.8 |
| 3 | Edinburgh (H) | 11 | 1.8 | 8 | 2.3 | −0.5 | −0.1 | +0.4 |
| 4 | Leinster (H) | 8 | 3.5 | 11 | 1.2 | +2.3 | +0.9 | +0.7 |
Att E = Attacking Entries, Pts/A = Points per entry, Def E = Defensive Entries, Pts C/Def = Point Conceded, Defence, NE = Net Efficiency, Roll-2 = Two game rolling average, Roll-3 = Three game rolling average
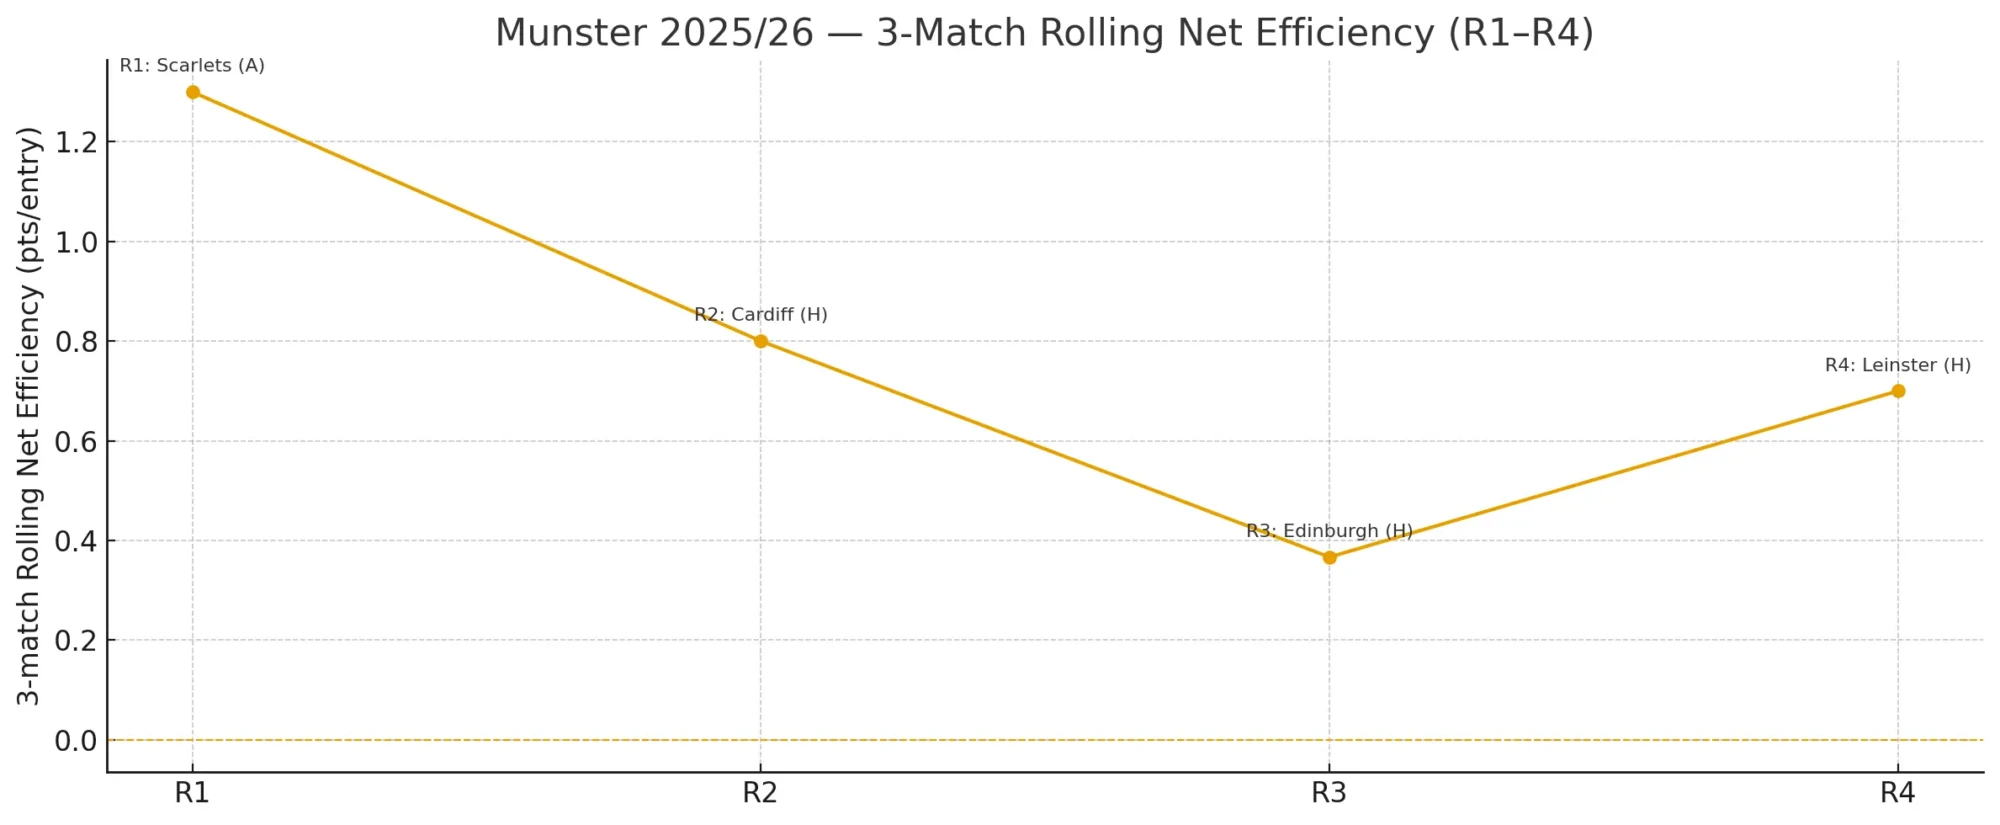
When we roll the Net Efficiency across a three-game average, we see another positive bump with the Edinburgh game the only drag on our underlying data.
Current Season Averages (R1–R4):
- Attacking Entries: 9.5 per game (getting close to that 10 entries per game water-mark)
- Points / Attacking Entry: 2.78
- Defensive Entries Conceded: 9.75 per game
- Points Conceded / Defensive Entry: 1.93
- Net Efficiency: +0.85
(For reference, 2024/25 season avg NE was –0.09 → big step forward.)
What this Leinster game tells us
Classic “quality beats quantity” win: despite fewer entries (8 vs 11), our elite strike rate (3.5) and stingy defence (1.2) produced a dominant +2.3 NE.
Both sides of the ledger spiked positively: relative to season averages, our attack was +0.73 pts/entry, defence —0.73 pts/entry (better) — a balanced, high-efficiency performance.
Form line improves again: Roll-2 jumps to +0.90, Roll-3 to +0.70 — a clear upward trend after the Edinburgh dip.
Try Conversion per 22 Entry
| R | Opp | Munster TR / E | Try-% (For) | Opp TR / E | Try-% (Against) |
|---|---|---|---|---|---|
| 1 | Scarlets (A) | 4 / 11 | 36.36% | 3 / 12 | 25.00% |
| 2 | Cardiff (H) | 3 / 8 | 37.50% | 4 / 8 | 50.00% |
| 3 | Edinburgh (H) | 4 / 11 | 36.36% | 3 / 8 | 37.50% |
| 4 | Leinster (H) | 4 / 8 | 50.00% | 2 / 11 | 18.18% |
TR = Tries, E = Entry
Season-to-Date (R1–R4)
- Munster: 15 tries from 38 entries → 39.5% (≈ 3.95 tries per 10 entries)
- Conceded: 12 tries from 39 entries → 30.8% (≈ 3.08 tries per 10 entries) Right where we want to be with that 30% watermark
- Net try-conversion edge: +8.7 percentage points (39.5 − 30.8)
Movement vs after R3
- For ↑ from 36.7% → 39.5% (+2.8 pp)
- Against ↓ from 35.7% → 30.8% (–4.9 pp)
The Leinster game was a big step forward on both sides of the ball; our best single-game attacking conversion (50%) and the stingiest conceded rate (18.2%), flipping the season aggregate in one game.
I Didn’t Read Any of that. What’s the TL;DR
Game Net Efficiency: +2.3 (outstanding)
Expected score: 28.0–13.2 (close to 31–14 actual, with Crowley’s penalty from outside the 22, the main points difference to the model)
Season NE: +0.85 through four rounds, trending up.
This was a signature efficiency win: fewer visits, far better finishing, and superior red-zone defence.