


With round 3 in the bag, we can finally start to get a read on this season’s Net Efficiency and, from what I’ve seen, there are two ways to look at it.
On the one hand, our metrics from game to game are going down. Going down is bad, although this is to be expected, in a lot of ways and counter-balanced with the fact that we won all three games while rotating quite a bit across all three games. That’s the ultimate aim — winning matches — and not just generating 22 entries.
But let’s have a look and try to add some context.
Munster’s Early-Season Efficiency: Defence is Driving the Wins
We evaluate each game by points per 22 entry — for and against — and take the difference:
Positive NE means we’re winning the per-visit battle in the red zone. We also track rolling averages (2- and 3-match) to smooth one-off noise.
Round-by-Round (URC R1–R3, 2025/26)
| Round | Opponent (score) | Att Entries | Pts/E (For) | Def Entries | Pts/E (Against) | NE | Expected margin (model) |
|---|---|---|---|---|---|---|---|
| 1 | Scarlets A (34–21) | 11 | 3.0 | 12 | 1.7 | +1.3 | (+12.6) → +13 actual |
| 2 | Cardiff H (23–20) | 8 | 2.8 | 8 | 2.5 | +0.3 | (+2.4) → +3 actual |
| 3 | Edinburgh H (20–19) | 11 | 1.8 | 8 | 2.3 | −0.5 | (+1.4) → +1 actual |
Why this stuff matters
- R1 and R3 featured four Munster tries; R2 had entry parity and came down to a small per-entry edge. Jack Crowley’s drop-goal, essentially, which still counted as a converted 22 Entry.
- The per-entry model closely matches our scorelines, validating this lens for week-to-week forecasting, at the moment anyway.
Try Conversion (how many entries end in a try)
| Match | Munster tries / entries | Try-% For | Opp tries / entries | Try-% Against |
|---|---|---|---|---|
| R1 @ Scarlets | 4 / 11 | 36.4% | 3 / 12 | 25.0% |
| R2 v Cardiff | 3 / 8 | 37.5% | 4 / 8 | 50.0% |
| R3 v Edinburgh | 4 / 11 | 36.4% | 3 / 8 | 37.5% |
Season so far: Munster 11/30 → 36.7%; Opponents 10/28 → 35.7%.
Net is basically even; wins are coming from what we allow per visit, not a dominant finishing edge.
Note: Last season, across both Europe and the URC, showed Munster at 42.6% For and 46.2% Against, showing a drop in attacking conversion but a massive increase in defensive action in a general sense.
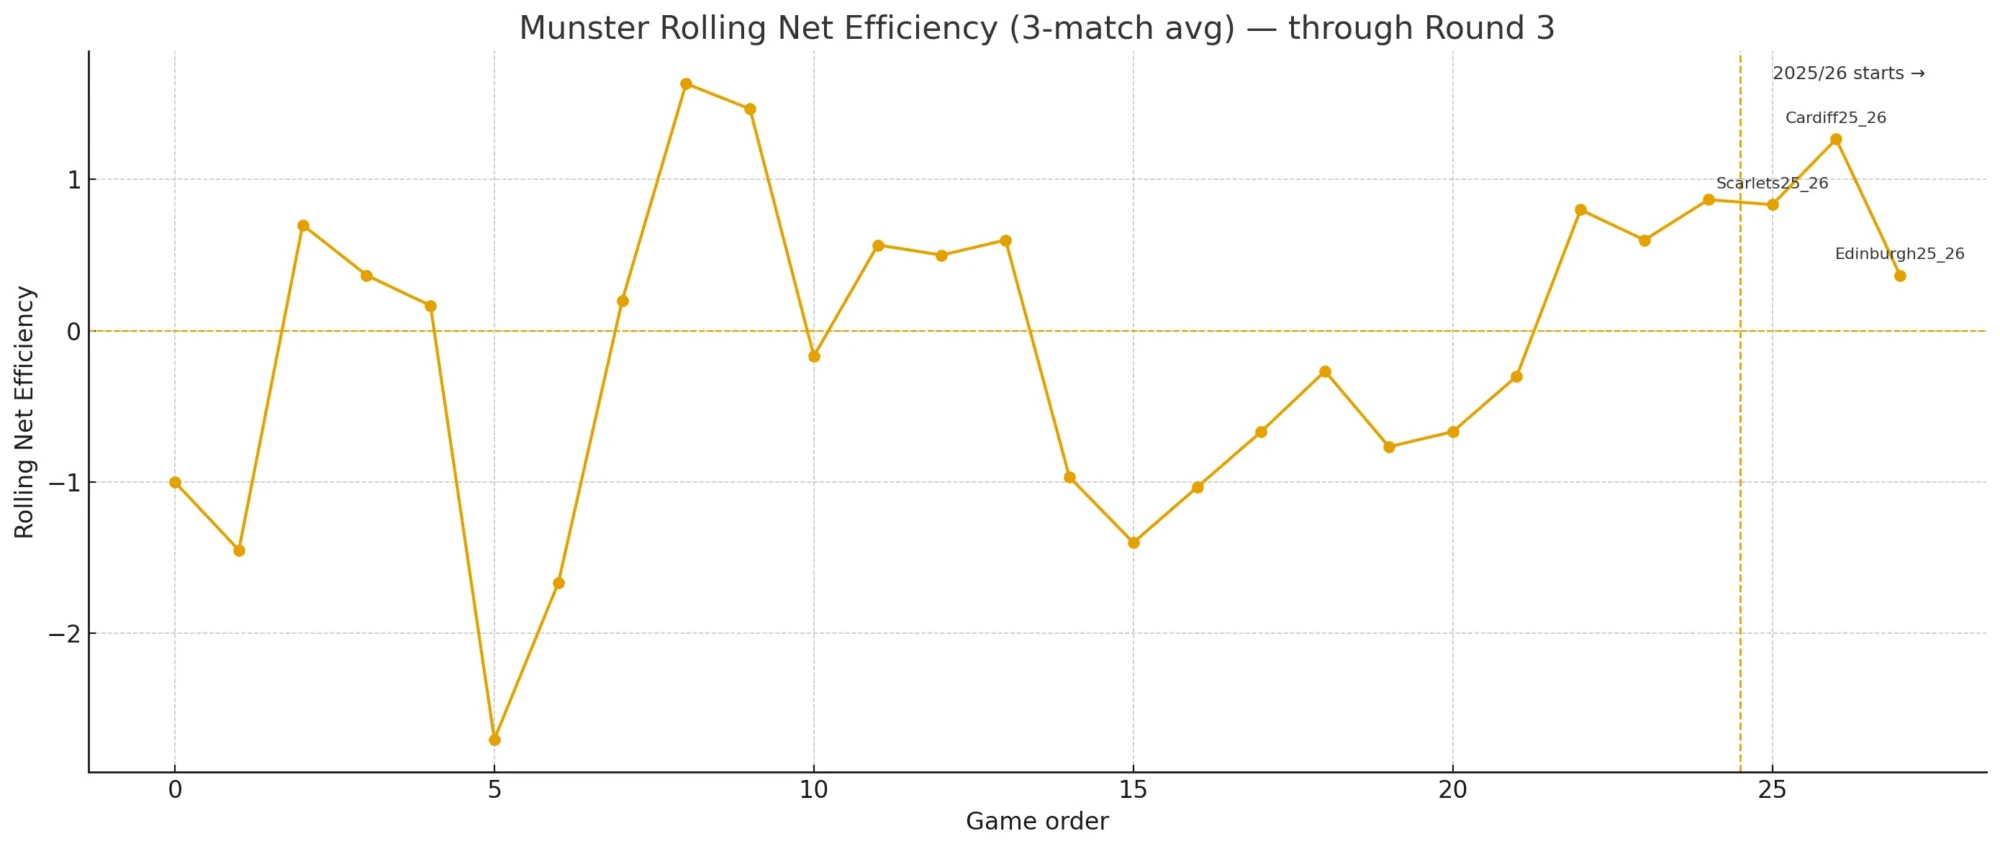
Rolling Form (2025/25 season only)
| Round | NE | 2-match rolling | 3-match rolling |
|---|---|---|---|
| 1 | +1.30 | +1.30 | +1.30 |
| 2 | +0.30 | +0.80 | +0.80 |
| 3 | −0.50 | −0.10 | +0.37 |
- The 2-match line dipped slightly after R3 (reflecting the lower attacking return vs Edinburgh).
- The 3-match line stays positive (+0.37), signalling underlying improvement versus last year’s baseline.
Comparison to Last Season (2024/25)
| Metric | 2024/25 average | 2025/26 (R1–R3) | Movement |
|---|---|---|---|
| Attacking entries | 8.56 | 10.00 | ▲ More visits |
| Points / attacking entry | 2.88 | 2.53 | ▼ Slightly lower strike rate |
| Defensive entries conceded | 7.56 | 9.33 | ▲ More visits conceded |
| Points conceded / defensive entry | 2.98 | 2.17 | ▼ Big defensive improvement |
| Net Efficiency | −0.09 | +0.37 | ↑ clear step forward |
Headline: Despite conceding more entries than last year, Munster’s goal-line defence has tightened dramatically (2.98 → 2.17 per entry). That alone flips the overall net from slightly negative to positive.
What’s Working
- Defence inside the 22: 2.17 pts/entry conceded is elite through three rounds and the primary driver of the positive NE.
- Volume creation: 10 entries/game is healthy; we out-created Scarlets and Edinburgh and held parity with Cardiff. How you rate these three opponents relative to the rotation we used in all three games is up for debate.
- Working through adversity: Three performances of varying quality against opponents with varying strengths — Cardiff defensive breakdown,
- Model alignment: Expected margins derived from entries and per-entry returns have tracked actual results within ~1 point.
What needs polish
- Attack conversion ceiling: R3’s 1.8 pts/entry drags the 3-game average to 2.53 (below last season’s 2.88). We left the scoreboard daylight on the table despite 11 entries, and our lineout misfiring against Edinburgh goes some way to explaining that.
- Entry control against: Opponents are getting 9.33 entries/game; if defensive concessions regress toward ~2.8, our margins will shrink fast.
Benchmarks for the next block
- Attack: push to ≥ 3.1 pts/entry (one extra seven-pointer across 10 entries turns tight wins into two-score cushions).
- Defence: hold ≤ 2.2 pts/entry conceded; that’s the current winning edge.
- Volume: squeeze opponents to ≤ 8 entries while maintaining our own around 10.
If we hit those three together, NE projects around +0.9 per entry—worth ~+7 to +9 on a typical 8–10 entry game.
Through three rounds, Munster’s start is defence-led: per-entry concession has really improved from ~3.0 to 2.17, which is why we could (a) win big at entry-deficit in R1, (b) edge an entry-parity game in R2, and (c) survive a low-conversion day in R3.
Lift the attacking strike back above 3.0 pts/entry, and this positive trend becomes sustainable — albeit with three difficult opponents to follow in the next three rounds.