


After yesterday’s Net Efficiency debut article, I had a ton of interest from subscribers to do a rating on other clubs in the European game to see (a) where Munster stacked up against them and (b) if there were key differences in how different teams’ net efficiency looked across a season.
I also had some interesting questions to see how a poor or scrappy lineout affects Net Efficiency, but I’m still working out how to quantify that as part of this series.
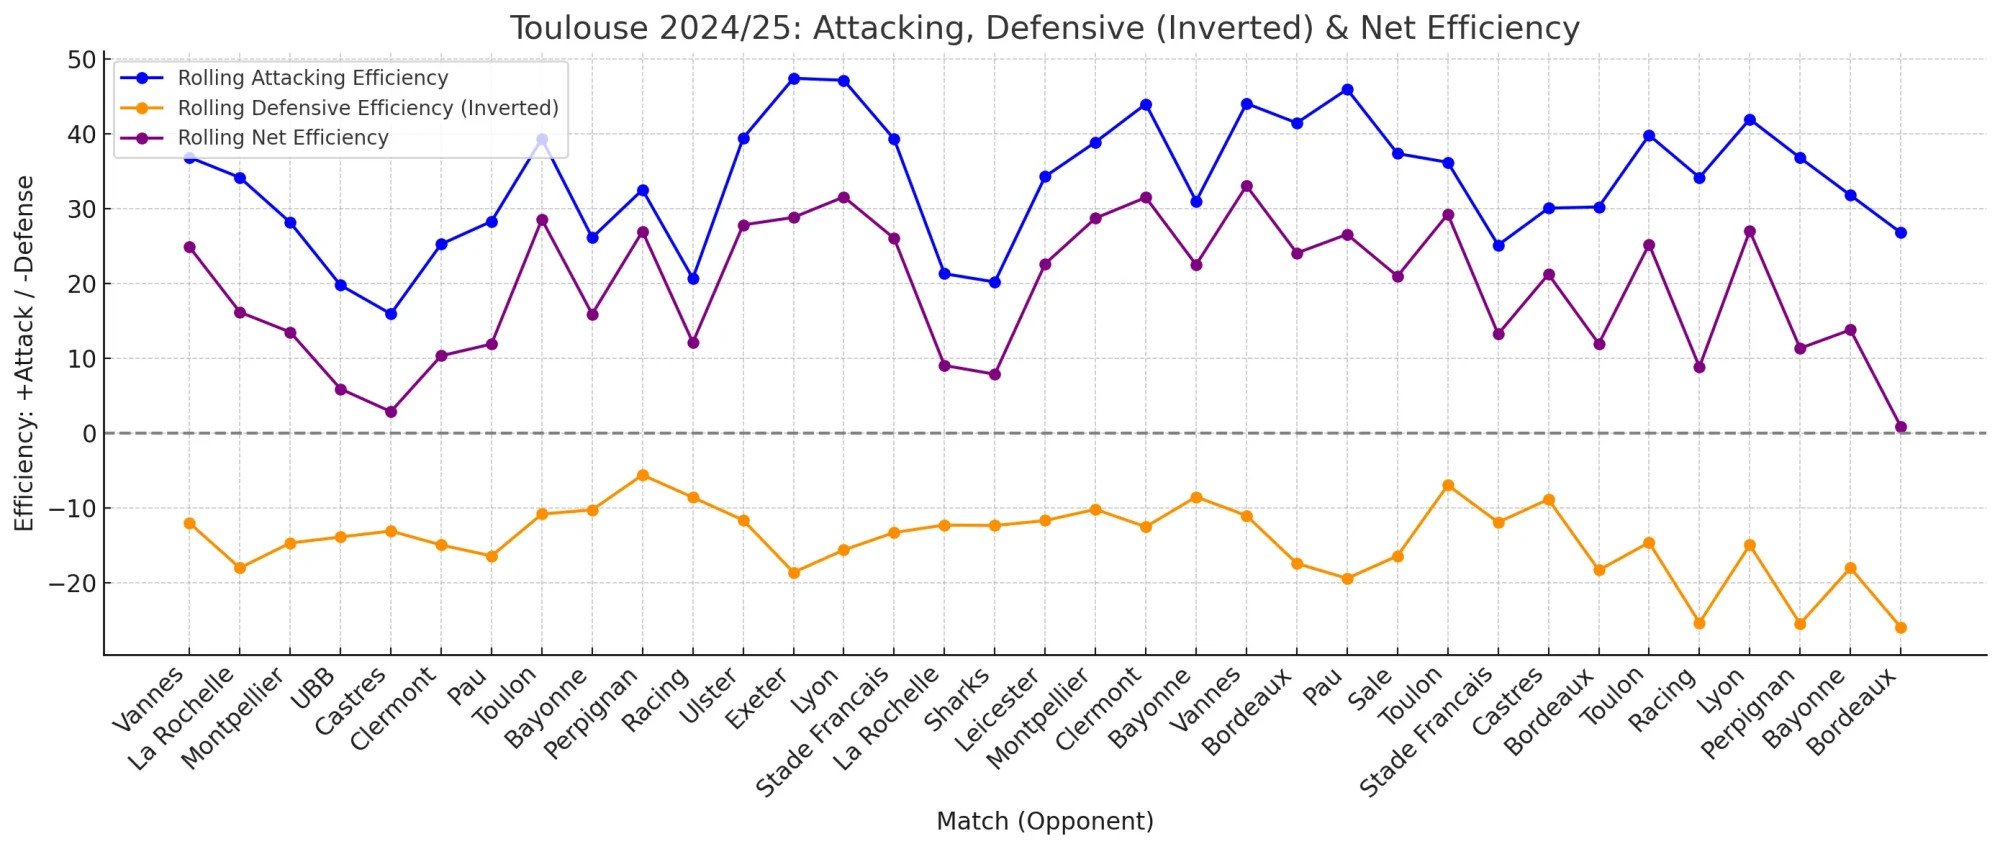
By far, the biggest request I had to do a Net Efficiency run on was for Toulouse. So I went through all their games for 2024/25 and here’s their graph.
As before, this is how I compile these charts;
-
🔵 Rolling Attacking Efficiency (Blue): Average points generated inside the 22 over 3 games.
-
🟠 Rolling Defensive Efficiency (Inverted) (Orange): Points conceded inside their own 22, shown as negative to highlight poor performance or lapses.
-
🟣 Net Efficiency (Purple): Difference between attacking and defensive efficiency – the most accurate gauge of performance. The further above the zero line, the better the net efficiency rating.
Toulouse 2024/25 – Efficiency-Based Performance Analysis
Key Tactical & Statistical Themes
Attacking Profile
- Highest scoring games: Leicester (15 entries @ 5.3), Exeter, Stade Français, Vannes 2
- Worst games: Bayonne (0.5), UBB 1 (1.3), Lyon (1.4)
- Style Insight: Toulouse are best when fast and vertical; they need tempo. Low possession = lower efficiency.
Defensive Profile
- Strongest games: Perpignan (0), Castres (0.7), Lyon (0)
- Weakest games: La Rochelle (twice), Racing, Perpignan late
- Style Insight: When opponents get repeated entries (10+), Toulouse’s defensive line buckles.
Net Efficiency Summary
| Net Efficiency Band | Games | Record | Notes |
|---|---|---|---|
| +15 or Higher | 14 | 13W / 1D | Domination zone |
| +5 to +14 | 9 | 8W / 1L | Comfortable control |
| 0 to +4 | 6 | 3W / 3L | Coin-flip territory |
| Negative | 6 | 2W / 4L | Danger zone, defence collapses or attack sputters |
Final Verdict: Toulouse’s Efficiency Identity
- Ceiling: Among the highest in Europe, capable of putting up 60-point net games and beating anyone.
- Floor: Surprisingly low. When efficiency drops, Toulouse lose fast, and rarely grind out wins from poor metrics.
- Consistency: Their biggest challenge. They rarely put up five good games in a row – a reflection of the challenge of the TOP14 and their need to rotate the squad – but any one game can be a rout against anyone.
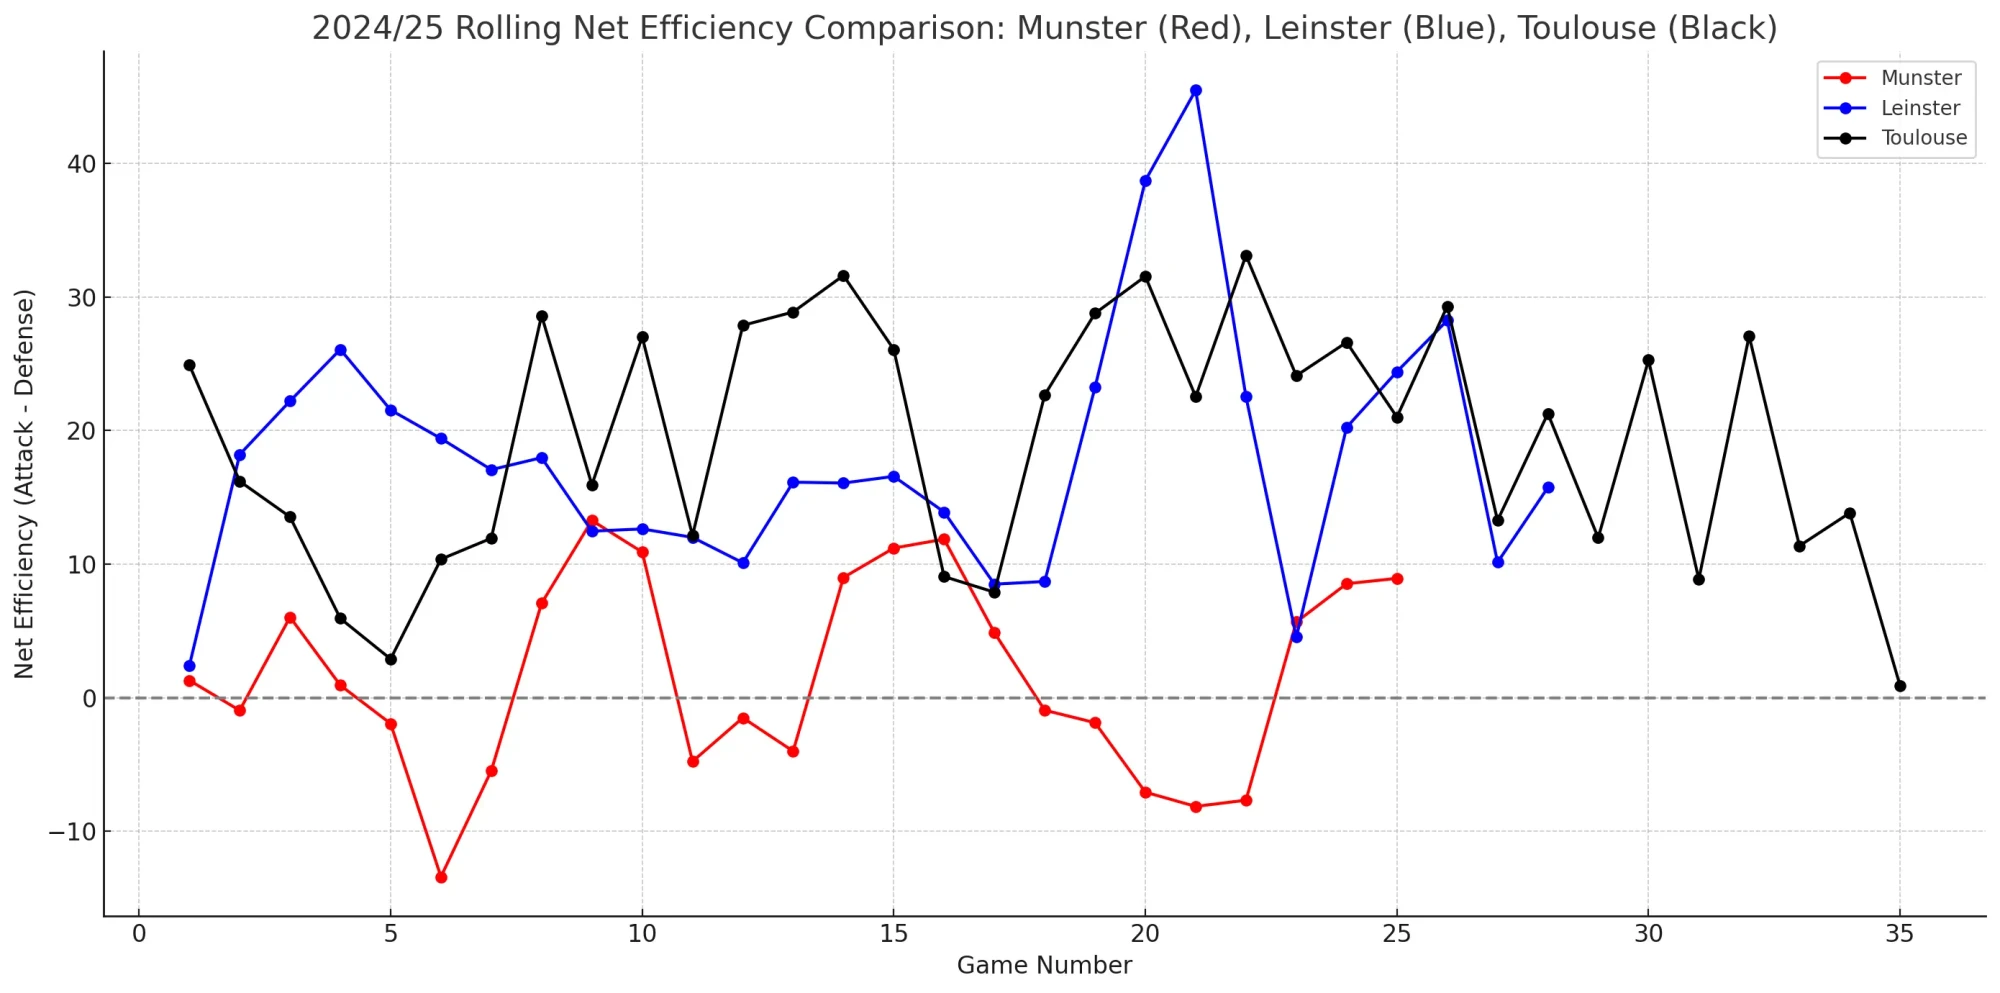
Let’s have a look at the Net Efficiency compared to Leinster and Munster.
What it Reveals
-
Leinster: Remarkably consistent. Their line is the smoothest, staying in positive territory all season.
-
Toulouse: High peaks and sharp drops. Explosive potential but volatile.
-
Munster: The most turbulent of the three sides, with huge swings before stabilising late in the season.
Just visually, the big takeaway here is how Toulouse (and Leinster) is how far above the zero line they stayed throughout the whole season on this rolling average. Munster were consistently dipping well below the zero line but why does the zero line matter here? What does it represent?
Why Net Efficiency Above the Zero Line Matters
In the elite game, dominance isn’t just about possession or territory; it’s about what you do in the red zone. That’s where Net Efficiency becomes one of the most telling metrics from both a raw data and visual standpoint. You can see when a team is trending into risky territory in a way that goes beyond the scoreboard.
Net Efficiency measures the difference between points scored and points conceded per 22 entry. A team that stays above the zero line is not just surviving, they’re winning the tactical battle where it matters most.
What the Zero Line Tells Us
- When a team remains above the zero line, it means they’re consistently converting pressure and entries into points while limiting the opposition’s return inside their own 22.
- This is the rugby equivalent of a profit margin. You can have moments of sloppiness or brilliance, but over time, the teams who maintain net efficiency above zero tend to win more, leak fewer scores, and dictate games over a season.
Case in Point
- Leinster hover comfortably above zero all season, and their win rate reflects it.
- Toulouse, on the other hand, seesaws up and down, getting near the zero line at points without ever going below it. So, brilliant at their best, but exposed when they slip.
- Munster’s resurgence post-Rowntree is literally tracked by their line climbing above zero initially before a difficult schedule, injuries and poor form pulled them back down.
The Literal Bottom Line
The zero line isn’t just a visual threshold — it’s a tactical barometer.
When you stay above it, you’re in control. When you drop below, you’re in trouble, whether the scoreboard shows it yet or not.